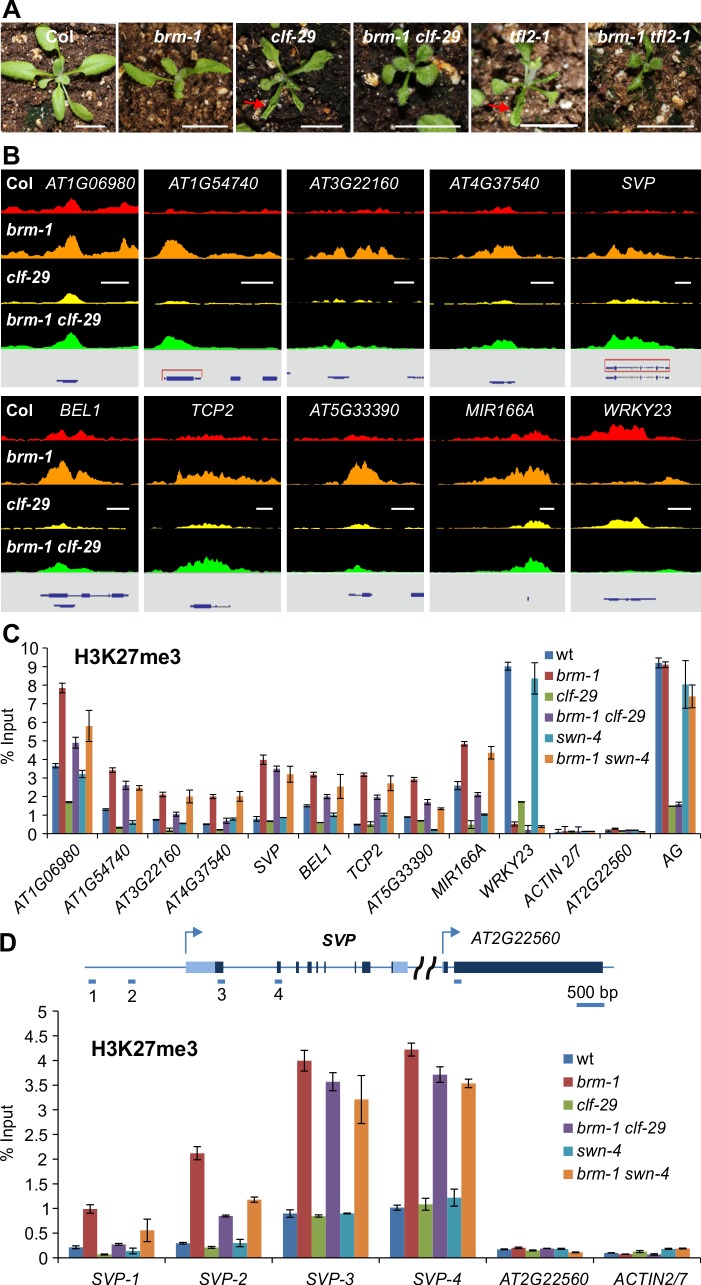
Figure 2. Removal of CLF or SWN activity in brm background results in a substantial decrease of H3K27me3 deposition.
(A) Loss of BRM activity partially rescues the up-wardly leaf curling phenotypes of clf-29 and tfl2-1. Scale bar: 1 cm. (B) ChIP-seq data comparing H3K27me3 levels at 10 selected genes in Col, brm-1, clf-29 and brm-1 clf-29. Data for the wild type Col are shown in red, brm-1 in orange, clf-29 in yellow, and brm-1 clf-29 in green. Gene structures are shown underneath each panel. Scale bars, 1Kb. (C) ChIP-qPCR validation of the H3K27me3 ChIP-seq data using independent samples; and ChIP-qPCR detection of H3K27me3 levels in swn-4 and brm-1 swn-4 mutants. ChIP signals are shown as percentage of input. ACTIN2/7 and AT2G22560 (a flanking gene of SVP) were used as negative control loci; and AG was used as a positive control locus. Error bars indicate standard deviations from three biological replicates. (D) Top panel: schematic representation of the genomic region covering SVP and the flanking gene AT2G22560. Dark and light blue boxes indicate exon and intron, respectively. Arrows indicate the transcription start sites. Short blue lines indicate the positions of primer pairs used. Bottom panel: ChIP-qPCR determining the levels of H3K27me3 across the SVP locus. ChIP signals are shown as percentage of input. Error bars indicate standard deviations from three biological replicates.

