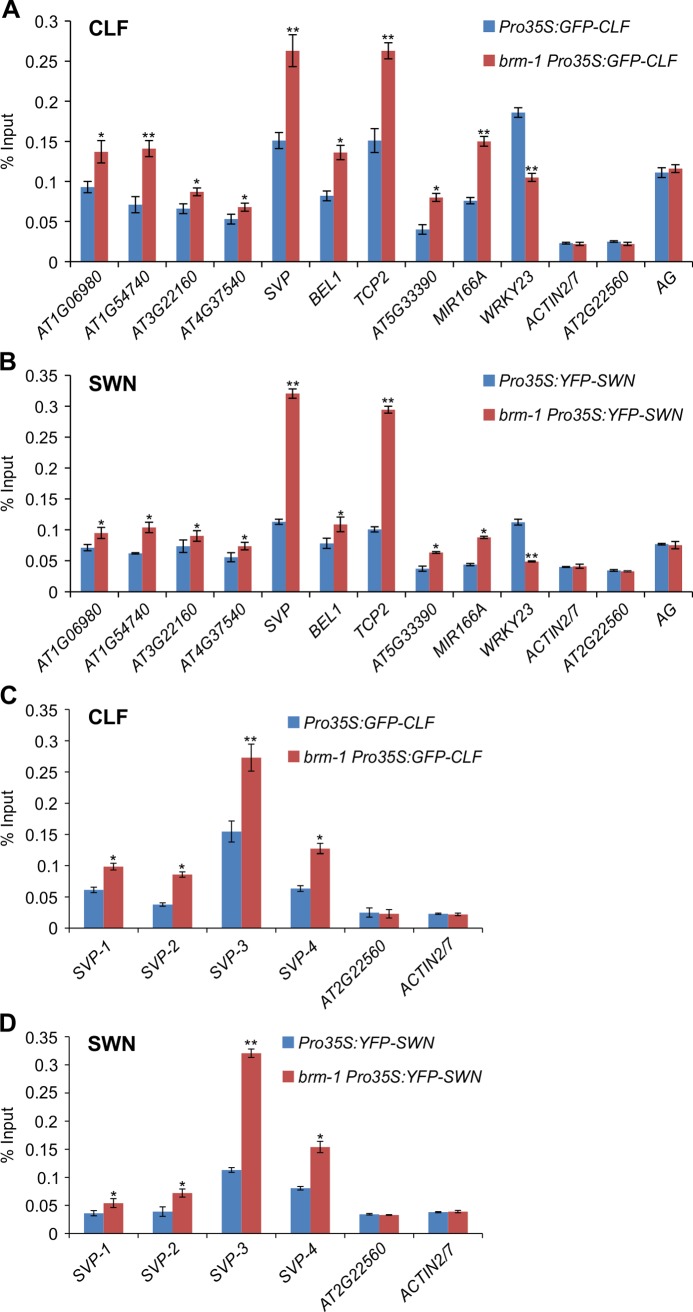
Figure 3. Physical occupancy of CLF and SWN at selected genes in brm mutants.
(A) Analysis of CLF occupancy at selected genes as determined by ChIP-qPCR using anti-GFP antibody in brm-1 Pro35S:GFP-CLF and Pro35S:GFP-CLF plants. (B) Analysis of SWN occupancy at selected genes as determined by ChIP-qPCR using anti-GFP antibody in brm-1 Pro35S:YFP-SWN and Pro35S:YFP-SWN plants. (C) and (D) ChIP-qPCR to determine the levels of CLF (C) and SWN (D) occupancy across the SVP locus. The primers used are the same as those in Fig. 2D. ChIP signals are shown as percentage of input. ACTIN2/7 and AT2G22560 were used as negative control loci. AG was a positive control locus. Error bars indicate standard deviations among three biological replicates. *: P < 0.05; **: P < 0.01.

