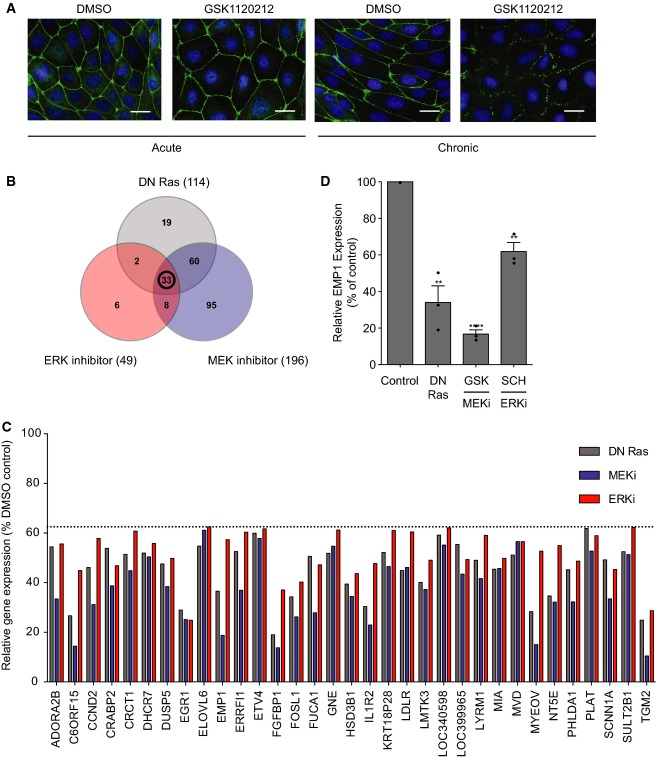
Figure 3. Ras, MEK and ERK control bronchial epithelial gene expression.
- A Acute versus chronic MEK inhibition. Acute (left panels): cells were seeded sparsely and incubated for 4 days in normal media and then subjected to a calcium switch and recovery, in the presence of DMSO (panel 1) or 500 nM GSK1120212 (panel 2). Chronic (right panels): cells were seeded sparsely and incubated for 4 days in DMSO (panel 3) or 500 nM GSK1120212 (panel 4). Cells were subjected to a calcium switch and recovery, in the presence of DMSO (panel 3) or 500 nM GSK1120212 (panel 4). Cells were fixed and stained for ZO-1 and DNA. Scale bar, 20 μm.
- B–D Microarray analysis. 16HBE cells were stably infected with pQCXIP (control) or pQCXIP expressing DN HRas. Control cells were treated with DMSO, GSK1120212 (500 nM) or SCH772984 (1 μM) for 4 days. RNA was isolated and analysed using an Illumina gene array; n = 3 independent samples were prepared for each condition. (B) Venn diagram representing genes downregulated by > 1.6-fold versus control, with an unadjusted P-value < 0.05. (C) Relative expression levels of 33 genes downregulated by DN HRas, MEK and ERK inhibition, expressed as % of DMSO control. (D) Relative expression levels of EMP1. Error bars denote mean ± SEM, and dots indicate individual data points. **P < 0.002 (DN Ras = 0.0019, ERKi = 0.0016); ****P < 0.0001.

