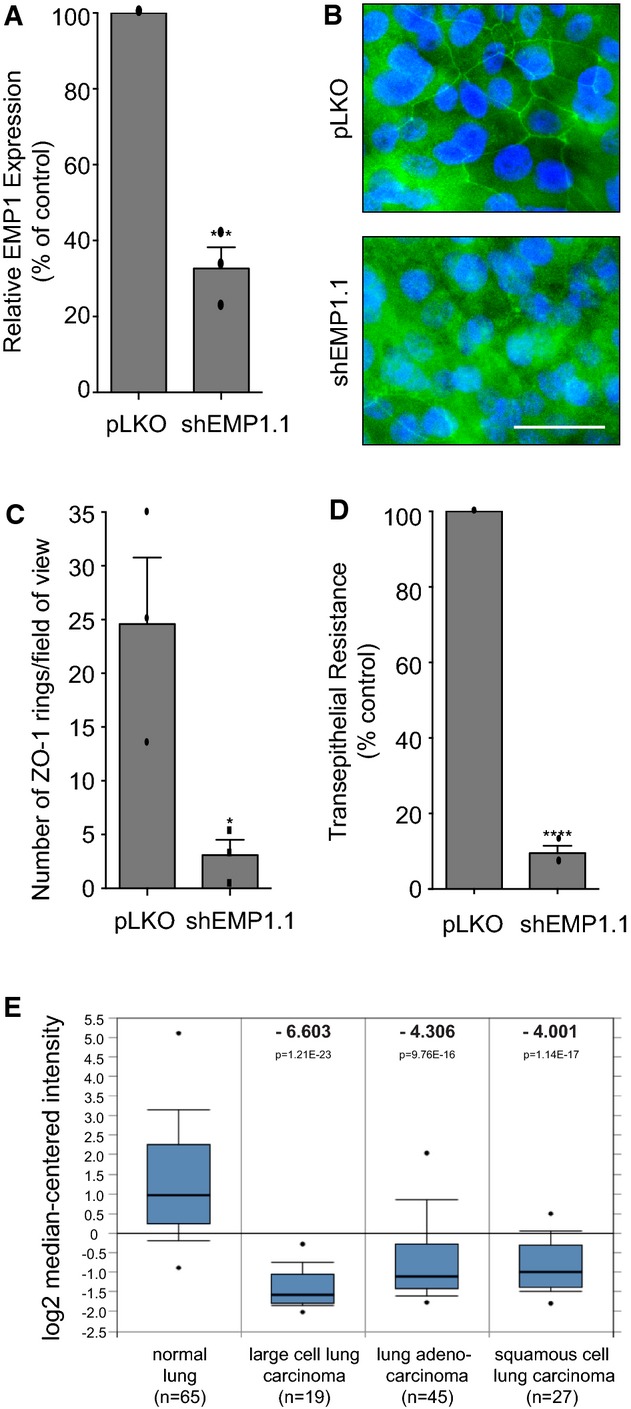
Figure 5. EMP1 in human airway basal progenitor-like cells and lung cancer.

- BCi-NS1.1 cells were stably infected with pLKO control or shEMP1.1. Total RNA was isolated and analysed for EMP1 expression using TaqMan/qPCR with a GAPDH control. Error bars denote mean ± SEM, ***P = 0.0003.
- Filter-grown cells as in (A) were fixed and stained for ZO-1 and DNA and analysed by confocal imaging.
- Quantification of tight junction phenotype of cells as in (A). > 500 cells were counted per sample/experiment, across n = 3 independent experiments (dots indicate individual data points). Error bars denote mean ± SEM. *P = 0.0276.
- Cells as in (A) were cultured on filters under ALI conditions, and transepithelial resistance (TER) was measured on day 21 post-seeding. Error bars denote mean ± SEM. ****P < 0.0001.
- EMP1 mRNA expression in normal lung versus cancer tissue. The Hou Lung data set was analysed using Oncomine software and the 213895_at reporter 45. Box-whisker plots are presented. The points represent the minimum/maximum values, bars denote the 10th–90th percentiles, boxes show the 25th–75th percentiles, and the horizontal line marks the median. The number of samples analysed (n), the fold change (bold) and the P-value are indicated.
Data information: Data are representative of n = 3 independent experiments.
