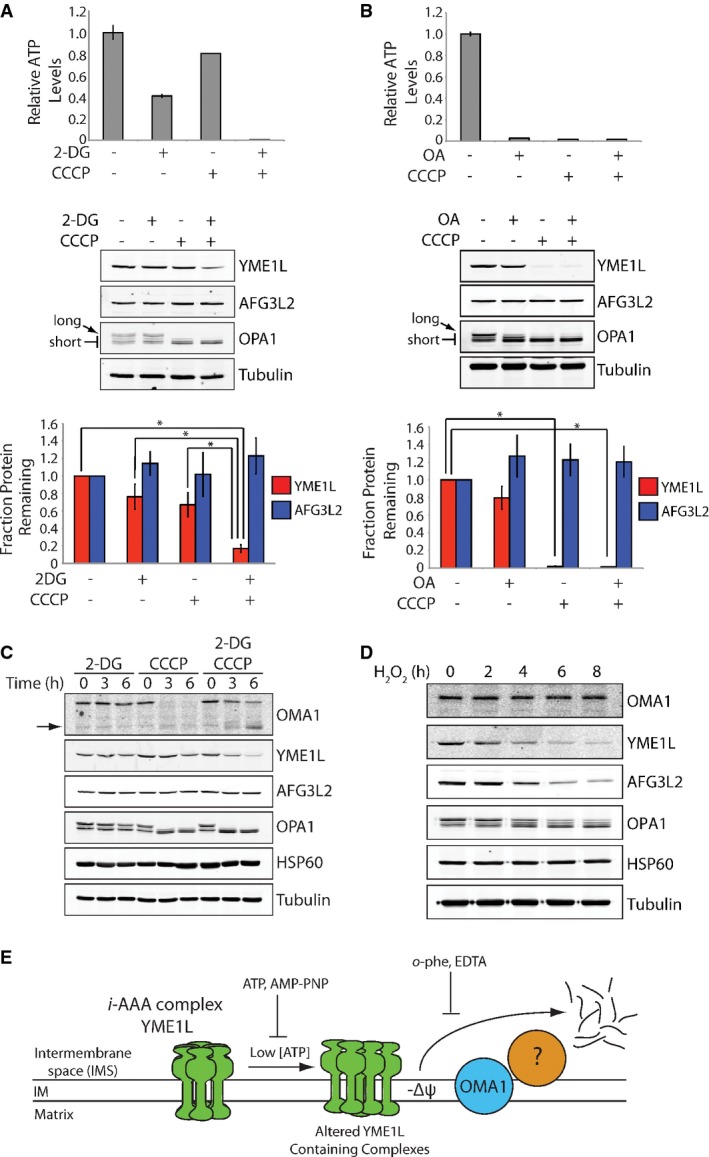
Figure 3.

YME1L degradation is initiated by reductions in intracellular ATP and OMA1 activation
- Top, bar graph showing the intracellular ATP levels in HEK293T cells incubated with 2-deoxyglucose (2-DG; 10 mM) and/or CCCP (50 μM) for 6 h, as indicated. Error bars show SEM for n = 3. Middle, representative immunoblot of lysates prepared from HEK293T cells incubated with 2-deoxyglucose (2-DG; 10 mM) and/or CCCP (50 μM) for 6 h, as indicated. The long and short isoforms of OPA1 are indicated by the arrows. Bottom, quantification of YME1L (red) and AFG3L2 (blue) from immunoblots as shown above. Error bars show SEM for n = 3. *P-value < 0.05.
- Top, bar graph showing the intracellular ATP levels in HEK293T cells cultured in galactose-supplemented media incubated with oligomycin A (OA; 5 nM) and/or CCCP (50 μM) for 6 h, as indicated. Error bars show SEM for n = 3. Middle, representative immunoblot of lysates prepared from HEK293T cells cultured in galactose-supplemented media incubated with oligomycin A (OA; 5 nM) and/or CCCP (50 μM) for 6 h, as indicated. The long and short isoforms of OPA1 are indicated by the arrows. Bottom, quantification of YME1L (red) and AFG3L2 (blue) from immunoblots as shown above. Error bars show SEM for n = 3. *P-value < 0.05.
- Immunoblot of lysates from HEK293T cells incubated with 2-deoxyglucose (2-DG; 10 mM) and/or CCCP (50 μM) for the indicated times. Full-length OMA1 (FL) and a cleaved, proteolytically active OMA1 fragment are shown by the arrows.
- Immunoblot of lysates from SHSY5Y cells treated with H2O2 (200 μM) for the indicated times.
- Illustration depicting the predicted mechanism for stress-induced YME1L degradation.
Source data are available online for this figure.
