
Figure 3. Complementation of the fer-1 mutation with related CrRLK1L proteins and domains.
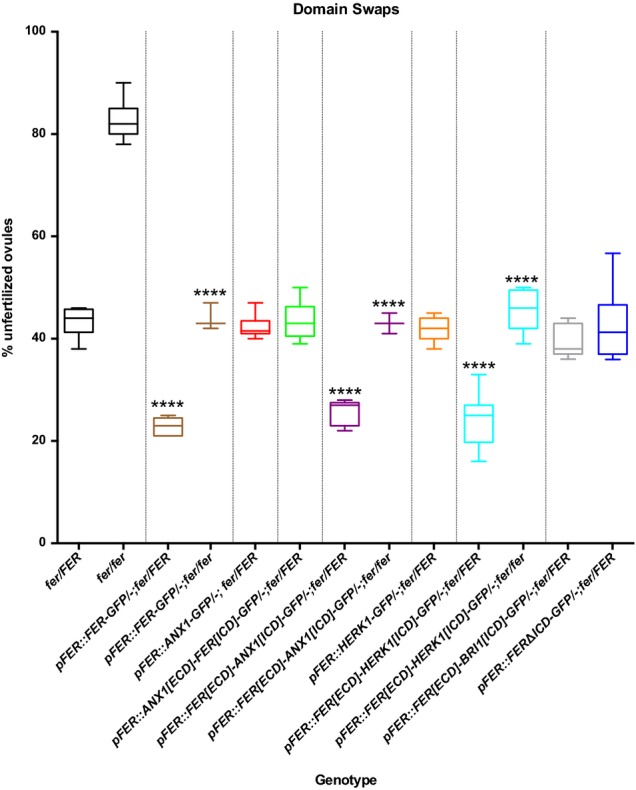
Box plots from complementation assays showing the percentage of unfertilized ovules for control plants and T1 transformants for each of the constructs. **** indicates lines with % unfertilized ovules significantly different from untransformed controls of the same genotype (P-values < 0.0001 in t-tests). At least 3 independent T1 plants (> 300 ovules counted for each) were analyzed for complementing and at least 8 T1 plants for non-complementing lines. See Supplementary Table S1 for raw seed count data.