
Figure 4. Site-directed mutagenesis of FER kinase domain.
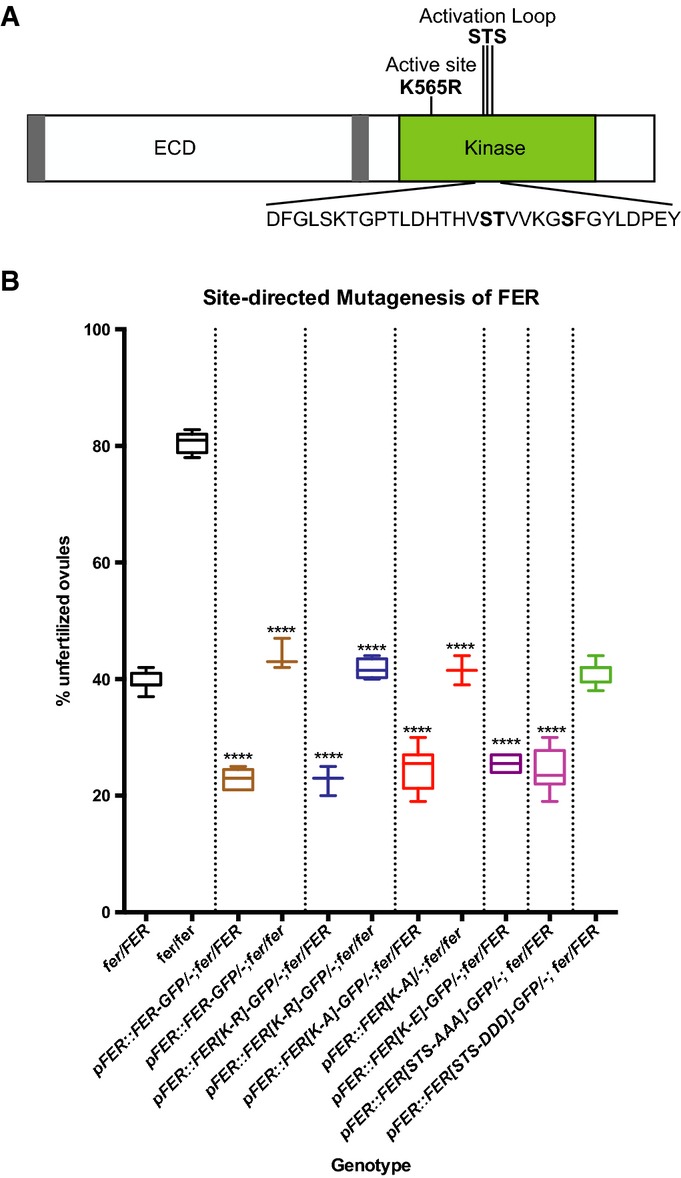
- FER protein domains and positions of the mutations introduced for complementation assays. The bold S, T, and S indicate targets for mutagenesis in the activation segment.
- Box plots from complementation assays showing the percentage of unfertilized ovules for control plants and T1 transformants for each of the site-directed mutagenesis constructs. **** indicates lines with % unfertilized ovules significantly different from untransformed controls of the same genotype (P-values < 0.0001 in t-tests). See Supplementary Table S2 for raw seed count data.