
Figure 3. Topological data analysis of the core network and entire yeast and human networks.
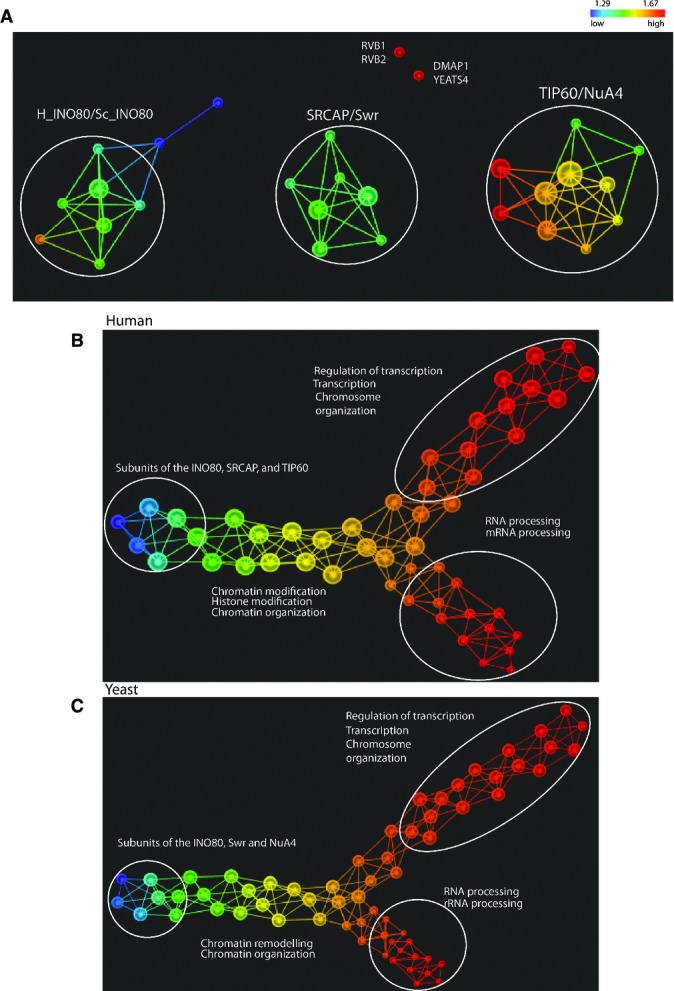
- A A Topological data analysis of the core network was performed on the protein abundance dataset of the 26 conserved proteins in the 69 yeast and human purifications. Principal metric SVD filters with normalized correlation were used (resolution 20, gain 4.0x). The size of a node in the topological network was proportional to the number of proteins. Proteins are colored based on the L-infinity centrality where red indicates high values and blue indicates low values. For simplicity, we listed only the human proteins names where individual proteins are shown.
- B,C Topological data analysis was performed on protein abundance of all yeast baits (B) and all human baits (C). L-infinity centrality filter with normalized correlation was used (resolution 35, gain 4.0x in B and resolution 45, gain 4.0x in C). Proteins are colored based on the L-infinity centrality. Color bar: red indicates high values and blue indicates low values. Biological functions of proteins in the respective flares which exhibit the lowest P-values or highest count as determined by DAVID annotation tool are listed. For simplicity, we show the GO terms that statistically best explain the protein list.