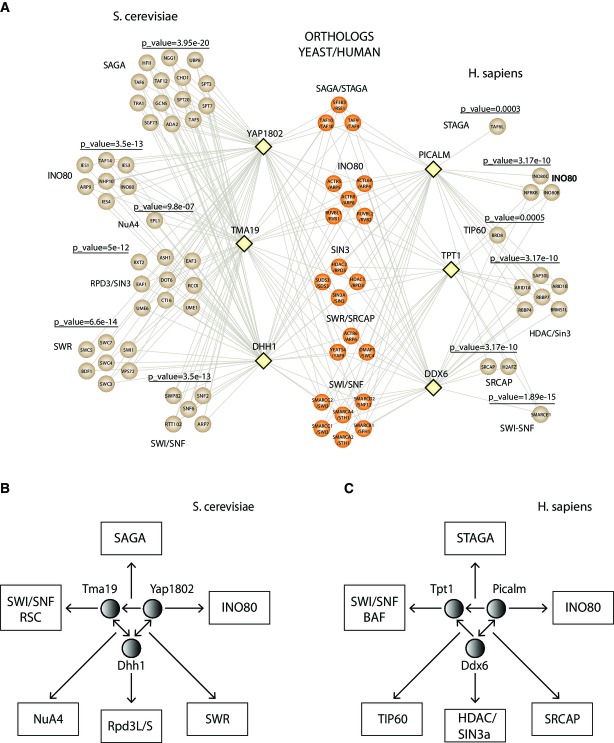
Figure 5. Conserved subnetwork and association with chromatin-remodeling complexes.
- A A conserved interaction network was constructed where nodes depicted by yellow diamonds represent the yeast/human baits and their edges are connected with proteins involved in the chromatin machinery. These prey proteins are illustrated by circles and are colored in brown. Conserved proteins between the two species were colored in dark orange. Significant P-values obtained from the hypergeometric distribution are also included on the top of each identified complex. Hypergeometric distribution accounts for the identified proteins in SAGA/STAGA, INO80, SIN3/HDAC, SWR/SRCAP, SWI/SNF, and NuA4/TIP60 and total number of proteins assigned by CORUM or SGD in these complexes.
- B, C Yeast and human proteins used as baits are indicated by a circle and associated chromatin complexes are included in rectangles. (B) In yeast, the bidirectional edge between YAP1802 and DHH1 as well as between TMA19 and DHH1 indicates that either one as a bait pulled down the other one as a prey. The directed edge from YAP1802 to TMA19 indicates that YAP1802 as a bait pulled-down TMA19 but not vice versa. (C) In human, the bidirectional edge between PICALM and DDX6 indicates that either one as a bait pulled down the other one as a prey. The directed edges from PICALM and DDX6 to TPT1 indicates that TPT1 as a bait did not pull down PICALM or DDX6 as a prey. The chromatin complexes are pulled down by at least one of the three baits in the subnetwork.

