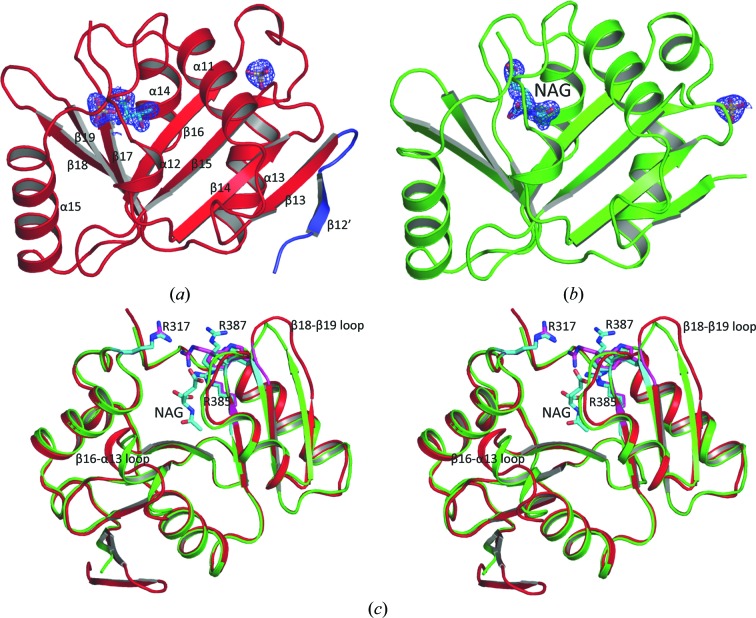
Figure 2.
Structure of xfNAT-ht. (a) Ribbon diagram of subunit A of xfNAT-ht, showing the extra β-strand in its N-terminal arm in blue. The sulfates and the modeled Thr in the active site are shown as sticks. (b) Ribbon diagram of subunit B of xfNAT-ht. The bound NAG is shown as sky-blue sticks. The electron-density map (2F o − F c) around the bound NAG (contoured at 1.0σ) is shown as a blue cage. (c) Superimposition of subunits A (in red ribbons) and B (in green ribbons) of xfNAT with a His tag. NAG bound in subunit B is shown as sky-blue sticks. The side chains of Arg317, Arg385 and Arg387 in subunits A and B are shown as sky-blue and magenta sticks, respectively. The conformations of the side chains of Arg387 are significantly different between subunits A and B. The largest difference in the main-chain atoms between subunits A and B was found in the β18–β19 loop, with an r.m.s. deviation of 4.56 Å

