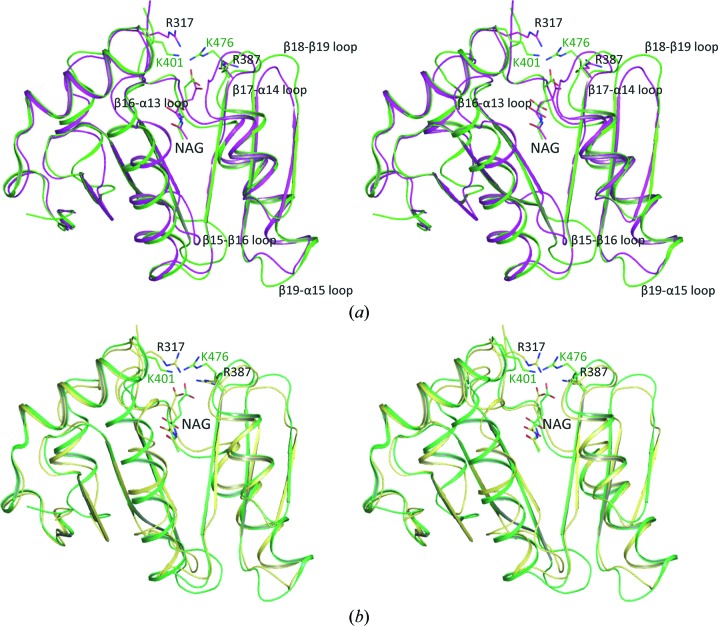
Figure 7.
Stereo diagrams of the superimposition of xfNAT with hNAT. (a) Superimposition of subunit B of xfNAT with subunit A of hNAT. The structure of xfNAT (subunit B) is shown as magenta ribbons, while the structure of hNAT (subunit A) is shown as green ribbons. The conformations of bound NAGs in xfNAT and hNAT are different and are shown as magenta and green sticks, respectively. (b) Superimposition of subunit C of xfNAT with subunit A of hNAT. The structure of xfNAT (subunit B) is shown as yellow ribbons. The structure of hNAT (subunit A) is shown as green ribbons. The conformations of bound NAGs in xfNAT and hNAT are similar and are shown as yellow and green sticks, respectively. Residues that are mentioned in the text are shown as sticks.

