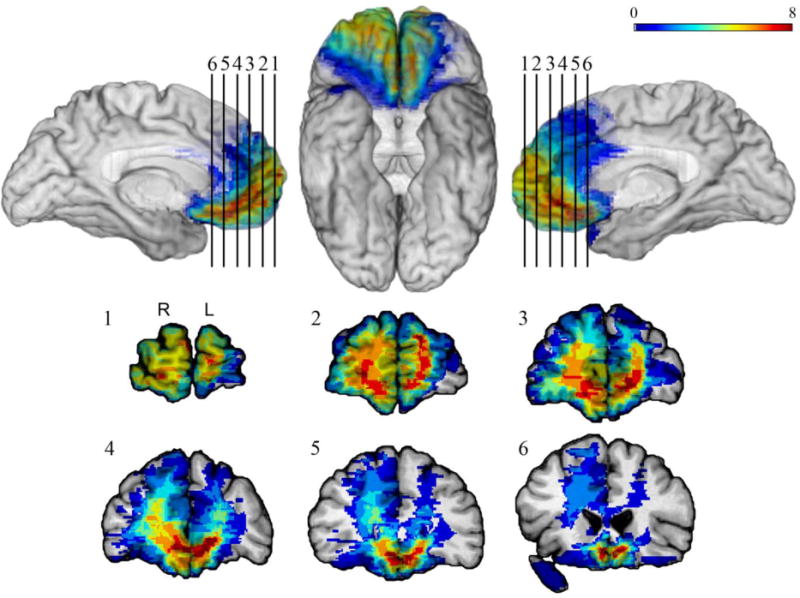
Figure 1.

MAP-3 lesion overlap map for the vmPFC lesion group. The color bar shows the extent of overlap, with warmer colors indicating higher numbers of patients with lesions overlapping at a given location. Overlap is mapped on mesial left hemisphere (top left), ventral (top middle), and mesial right hemisphere (top right) views, and the coronal sections (1–6) show the extent of overlap in subcortical areas.
