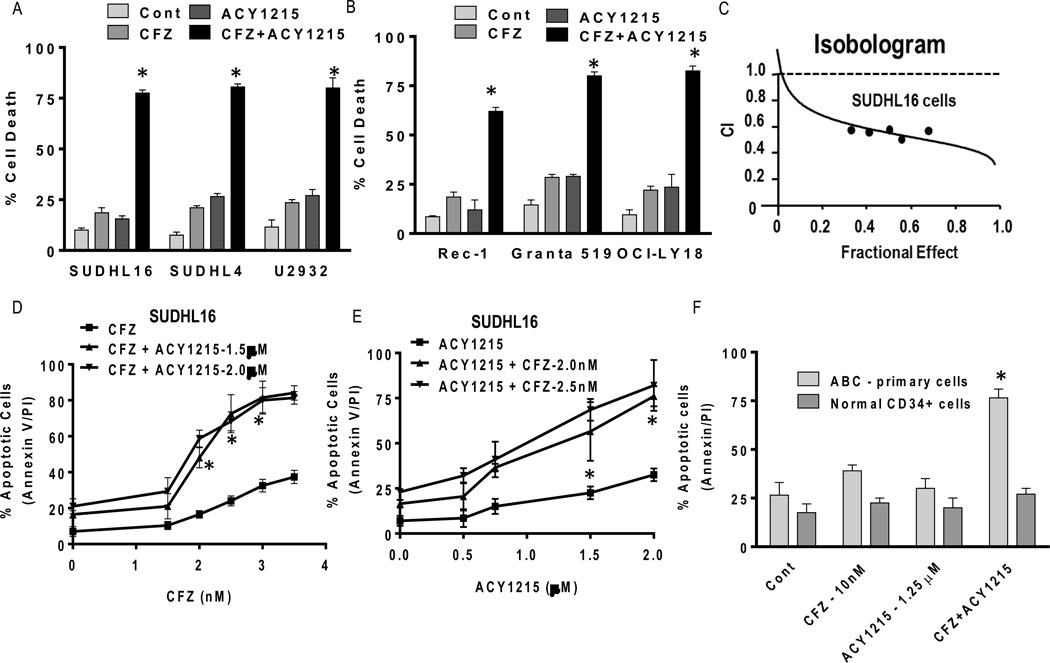
Figure 1. ACY1215 interacts synergistically with CFZ in multiple NHL models and primary DLBCL cells, but not in normal cells.
(A–B) Cells were treated with minimally toxic concentrations of CFZ (SUDHL16-2.5 nM, SUDHL4, U2932 and Granta 519-3.5 nM, Rec-1–15 nM, OCI-LY18-3.0 nM) in the presence or absence of ACY1215 (1.5–2.0 µM) for 48h, after which cell death was monitored by 7-AAD staining and flow cytometry (C) Fractional Effect (FA) values were determined by comparing results obtained for untreated controls and treated SUDHL16 cells following exposure to agents (36h) administered at a fixed ratio (CFZ:ACY1215::2.5:1500), as per Median Dose Effect analysis. Combination Index (C.I.) values less than 1.0 denote a synergistic interaction. (D) SUDHL16 cells were treated with varying CFZ (1.5–3.5 nM) concentrations in the presence or absence of fixed concentrations of ACY1215 (1.5–2.0 µM); alternatively, (E) cells were treated with varying ACY1215 (0.5–2.0 µM) concentrations ± fixed concentrations of CFZ (2.0–2.5 nM) for 48h, after which cell death was monitored by flow cytometry and AnnexinV/PI staining. (F) Primary human DLBCL (ABC subtype) mononuclear cells (90% purity) were isolated as described in Methods and resuspended in medium containing 10% FCS at a density of 0.6 × 10⁶ cells/mL. Bone marrow CD34+ cells were isolated as described in Methods. Both samples were exposed to CFZ (10 nM) ± ACY1215 (1.25 µM) for 14h. Cell death was monitored by Annexin V/PI staining. For all studies, values represent the means for 3 independent experiments performed in triplicate ± S.D. For A–B * = significantly more than values obtained for CFZ or ACY1215 treatment alone; P < 0.02. D–F, * = significantly greater than values obtained for CFZ or ACY1215 treatment alone P < 0.04.

