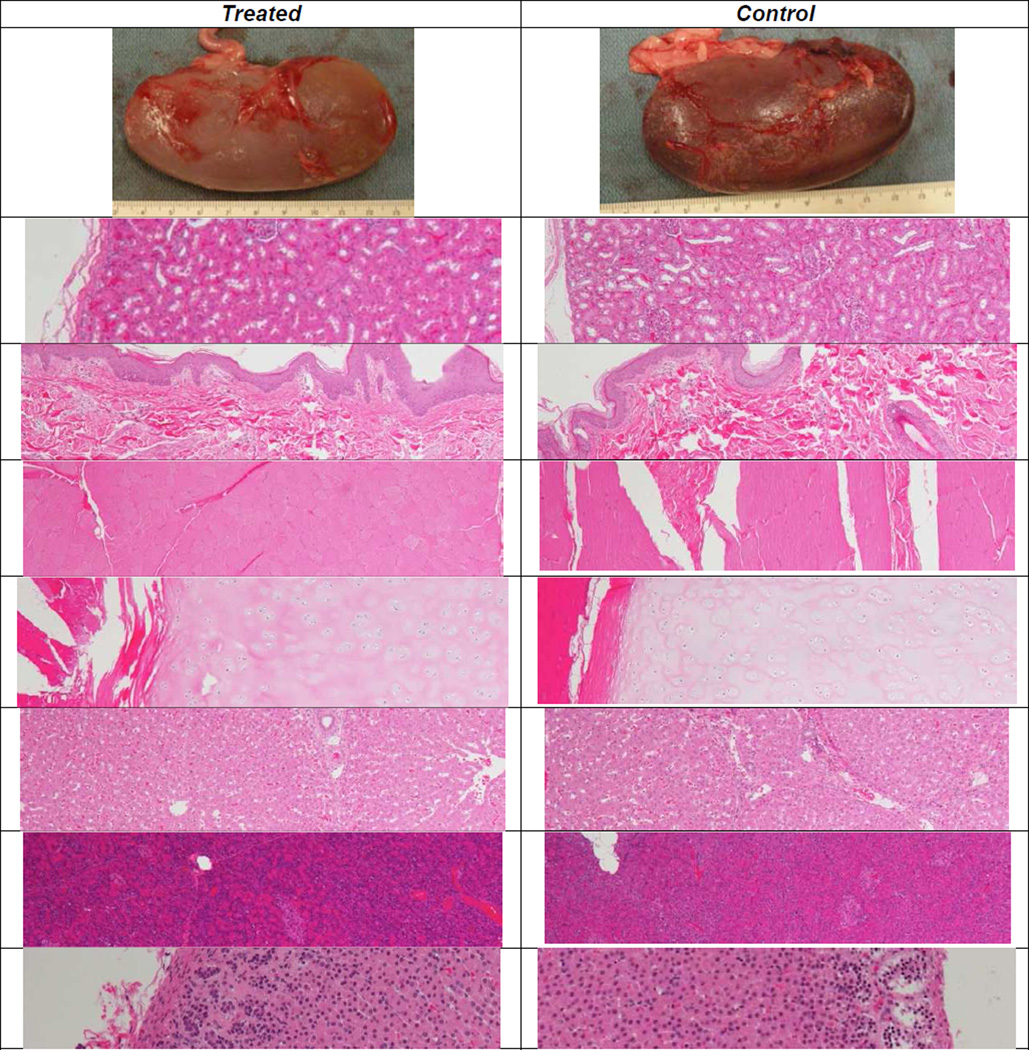
Figure 2.
Histology images (4× magnification except where noted) of treated (left) and control (right) tissues. From the top, tissues are: right kidney posterior (gross), kidney, skin, body wall muscle, rib cartilage, liver, pancreas, and adrenal gland (10×). The histologic features of the treated tissues did not differ from those of the controls.

