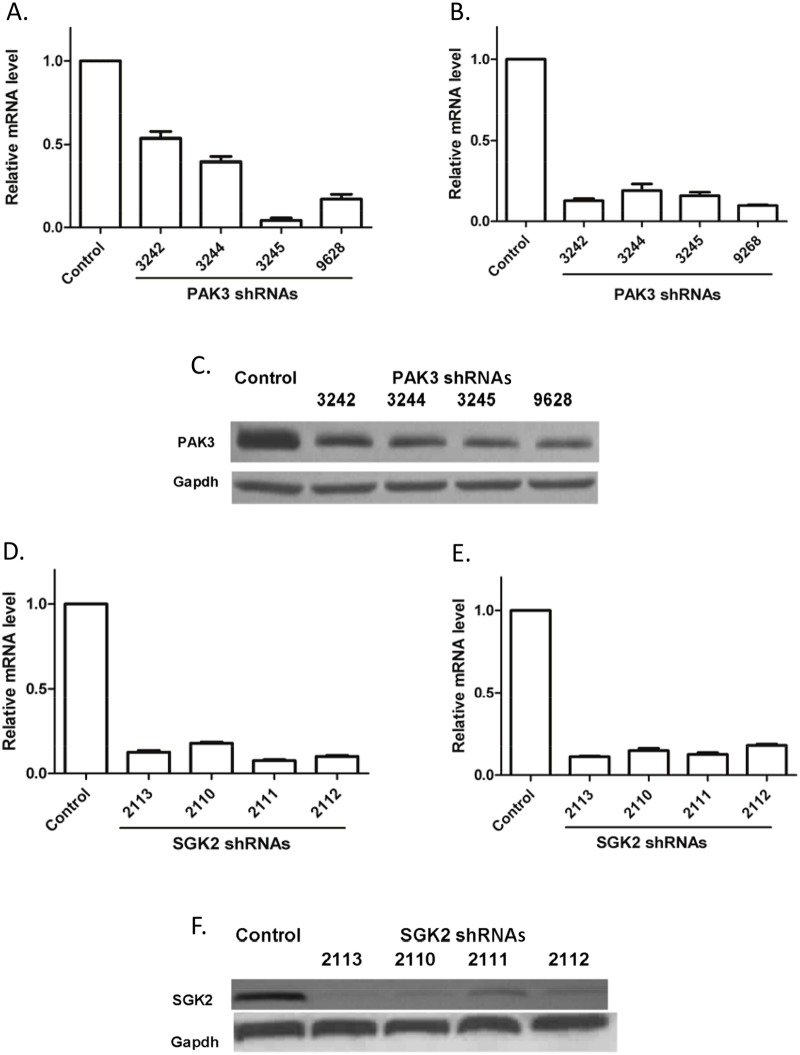
Figure 1. Knockdown of PAK3 and SGK2 by shRNAs.
mRNA levels were determined by quantitative reverse transcription PCR analysis at 72 hours after infection with the respective shRNA vectors; control denotes infection with a vector encoding non-target shRNA. Each bar on the bar graph represents the average ± standard deviation of 4 replicates from one of three independent experiments with similar results. mRNA levels were normalized with GAPDH expression; PAK3 and SGK2 protein expression were determined 72 hours after infection using a Western immunoblot. GAPDH protein acted as a protein loading control for each sample. (A) PAK3 shRNA decreased PAK3 mRNA levels in HeLa cells; (B) PAK3 shRNAs reduced PAK3 mRNA expression in DMS-79 cells; (C) PAK3 shRNAs reduced PAK3 protein expression in DMS-79 cells. DMS-79 cell lysates were analyzed with PAK3 monoclonal antibody N-19; (D) SGK2 shRNAs reduced SGK2 mRNA levels in HeLa cells; (E) SGK2 shRNAs reduced SGK2 mRNA levels in GTL16 cells; (F) SGK2 shRNAs reduced SGK2 protein levels in GTL16 cells. GTL16 cell lysates were analyzed with SGK2 monoclonal antibody 3Q-2.

