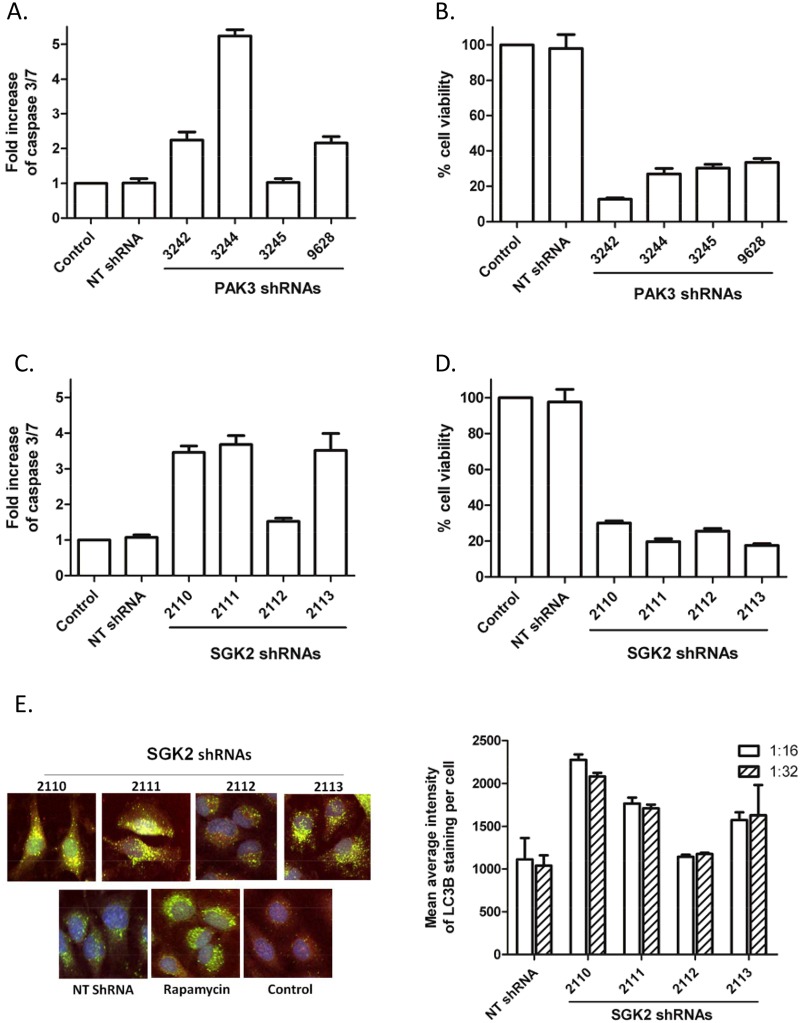
Figure 2. Loss of cell viability induced by PAK3 or SGK2 shRNAs.
(A) HeLa cells were infected with PAK3 shRNA at a 1:10 dilution. Cell apoptosis was determined using a caspase 3/7 glo luciferase assay 72 hours after infection. The bar graph presents fold changes of caspase 3/7 activity (luminescence) induced by various shRNAs compared with a no-shRNA control. Data represent the average ± standard deviation of 4 replicates from one of two separate experiments with similar results; (B) Inhibition of proliferation/viability of HeLa cells by PAK3 shRNAs was assessed using a CellTiter blue assay 5 days after infection. The bar graph presents percent viability (fluorescence) of lentiviral shRNA-infected cells compared with a control lentivirus without shRNA expression. Data represent the mean ± standard deviation of three independent experiments; (C) SGK2 lentiviral shRNAs induced HeLa cell apoptosis. Data represent 4 replicates from one of two separate experiments with similar results; (D) SGK2 shRNAs inhibited proliferation/viability of HeLa cells. Data represent the average ± standard deviation of two independent experiments; (E) SGK2 lentiviral shRNAs induced autophagy of HeLa cells. Cells were infected with SGK2 lentiviral shRNAs at 1:16 and 1:32 dilution, respectively. 1 μM Rapamycin was included as an autophagy control on each plate. Cell plates were fixed 72 hour after infection and immunostained for induction of autophagy with a LC3B primary antibody, followed with an Alexa 488-conjugated secondary antibody. Images were captured using the confocal Opera High Content Imager. Images of SGK2 lentiviral shRNA-infected HeLa cells (~1200 cells/well) were captured and cell numbers counted. The average intensity of LC3B staining per cell was measured and calculated using a modified Capella (Perkin Elmer) algorithm. The bar graph presents the average ± standard deviation of LC3B staining intensity derived from two wells.

