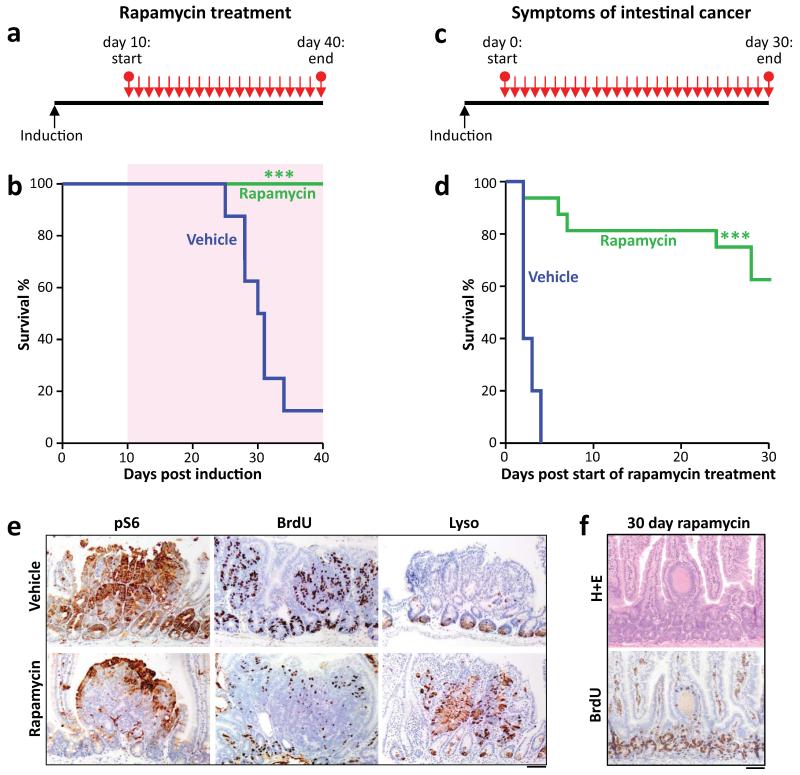
Figure 2. Apc-driven tumourigenesis requires mTORC1 activation.
a+b) Graphical representation of prophylactic rapamycin treatment strategy and Kaplan-Meyer survival curve showing that prophylactic rapamycin treatment prevents tumourigenesis. 10mg/kg rapamycin treatment began at Day 10 post-Apc deletion, and lasted 30 days, after which mice were sampled. Area highlighted by red indicates duration of rapamycin treatment (n=8, vehicle; n=13 rapamycin; ***p-value≤0.001, Log Rank test); c+d) Graphical representation of chemotherapeutic rapamycin treatment strategy and Kaplan-Meyer survival curve showing that rapamycin treatment can regress established intestinal tumours. 10mg/kg rapamycin treatment started when mice showed signs of intestinal disease, and lasted 30 days, after which mice were sampled. Graph represents survival while on rapamycin treatment (n=5, vehicle; n= 16, rapamycin; ***p-value≤0.001, Log Rank test); e) Representative IHC of phospho-rpS6, BrdU and Lysozyme, showing that 72hrs of 10mg/kg rapamycin treatment causes a loss in rpS6 phosphorylation and BrdU positivity, and an increase in lysozyme staining in intestinal tumours (representative of 5 biological replicates); f) Representative H+E and IHC for BrdU showing that small, non-proliferative lesions remain after 30 days of 10mg/kg rapamycin treatment (representative of 5 biological replicates). Scale bar = 100μm

