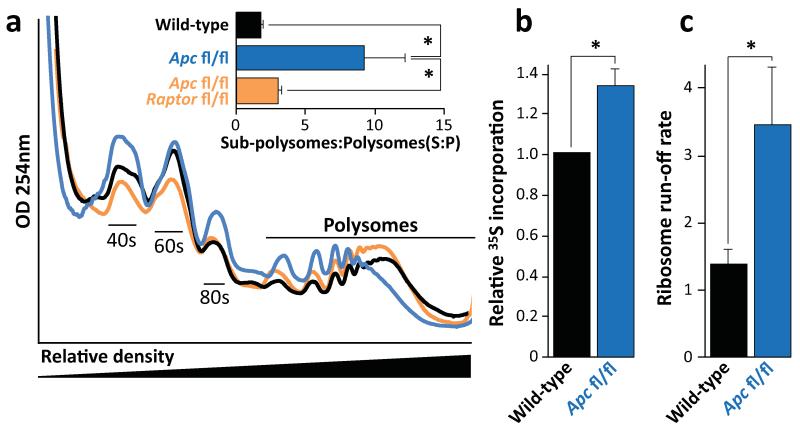
Figure 3. mTORC1 drives increased translational elongation.
a) Representative polysome profiles of intestinal epithelial cells showing altered RNA distribution 96hrs after Apc deletion. Bar graph represents the ratio of sub-polysomes compared to polysomes (S:P). Data are average ± s.e.m. (n=3 per group; *p-value≤0.05, Mann-Whitney U test); b) Intestinal crypt culture was pulsed for 30 min with 35S-labelled methionine/cysteine. Incorporation of 35S into protein was quantified by scintillation counting and normalized to total protein. Apc deletion increases 35S incorporation. Data are average ± s.e.m. (n=3 biological replicates per group; *p-value≤0.05, Mann-Whitney U test); c) The ribosome run-off rate was measured by addition of the initiation inhibitor harringtonine to ex vivo crypts from wild-type and Apc deleted mice. Harringtonine was added for 0 or 180 seconds and the increase in sub-polysomes (S) relative to polysome (P) calculated. This run-off rate represents the shift in S:P between the two time points, which is proportional to elongation speed. Data are average ± s.e.m. (n=3 biological replicates per group; *p-value≤0.05, Mann Whitney U test). Also see Supplemental Figure 7.

