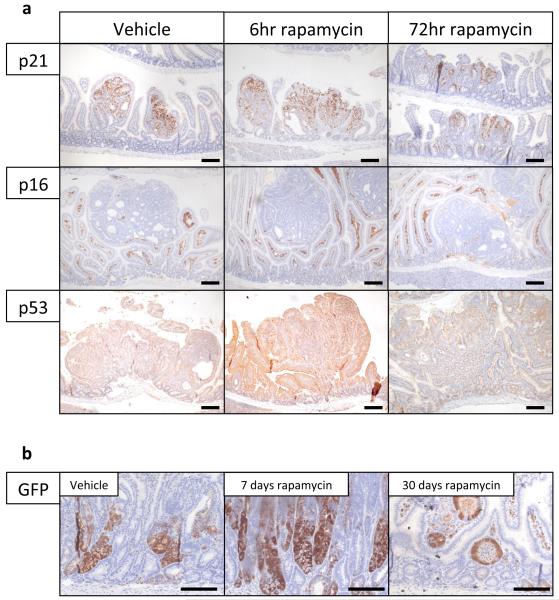
Extended Data Fig. 4. IHC following rapamycin treatment.
a) Representative IHC of p21, p16, and p53 after 6hrs and 72hrs of 10mg/kg rapamycin treatment. Staining shows no induction of these proteins in tumours following rapamycin treatment (representative of 5 biological replicates).; b) Representative IHC for LGR5 GFP showing high numbers of LGR5-positive cells after 7 and 30 days of 10mg/kg daily rapamycin treatment. (representative of 5 biological replicates). Scale bar = 100μm.

