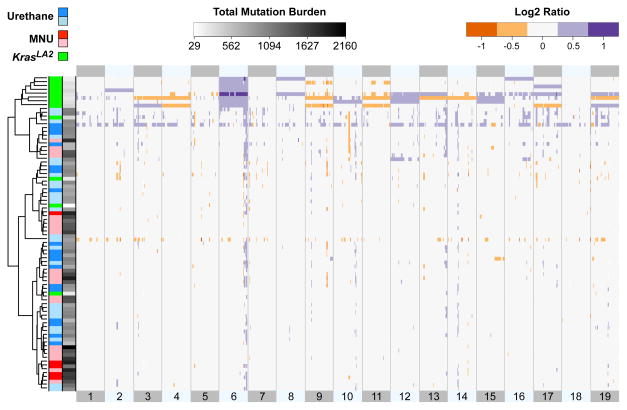
Figure 2. Distinct copy number profiles of genetically- and chemically-induced tumours.
Unsupervised, hierarchical clustering of log2 transformed read count ratios. KrasLA2 tumours showed a significantly higher number of CNAs compared to carcinogen-induced tumours (p = 4.3−10, Wilcoxon rank-sum test). Chromosomes are aligned head to tail on the X axis, starting at the left. Samples are labeled by treatment and genotype, with Kras+/− samples appearing as light blue and light red. Sample SNV burden is displayed along the Y axis in greyscale.

