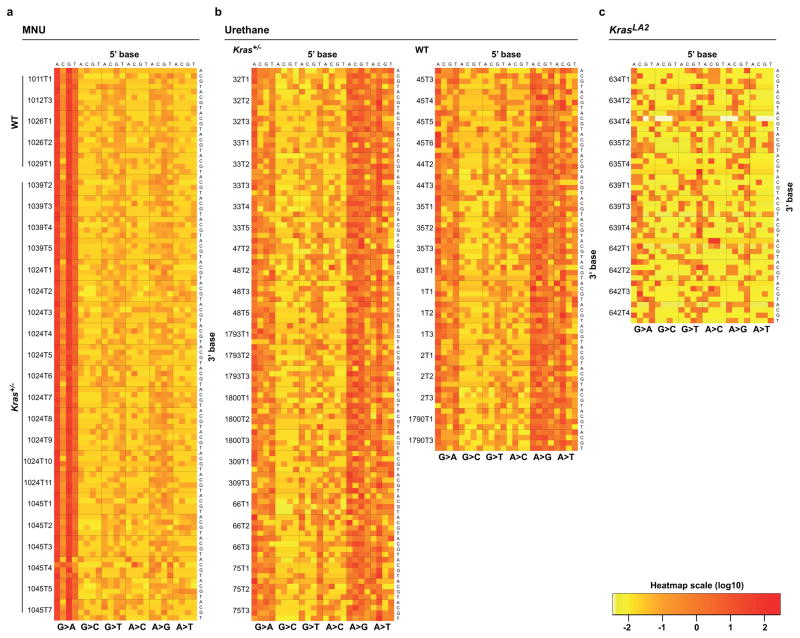
Extended Data Figure 1. Distinct and consistent mutation spectra across tumours from carcinogen and genetic models.
a–c, Stacked heatmaps displaying the mutation spectra of all MNU-induced, a, urethane-induced, b, and KrasLA2, c, tumours, shown as normalized frequencies of all 96 possible substitutions. Substitutions are shown below each heatmap, with 5′- and 3′-flanking base context displayed on the top and right, respectively. Tumour ID is shown to the left of each heatmap.

