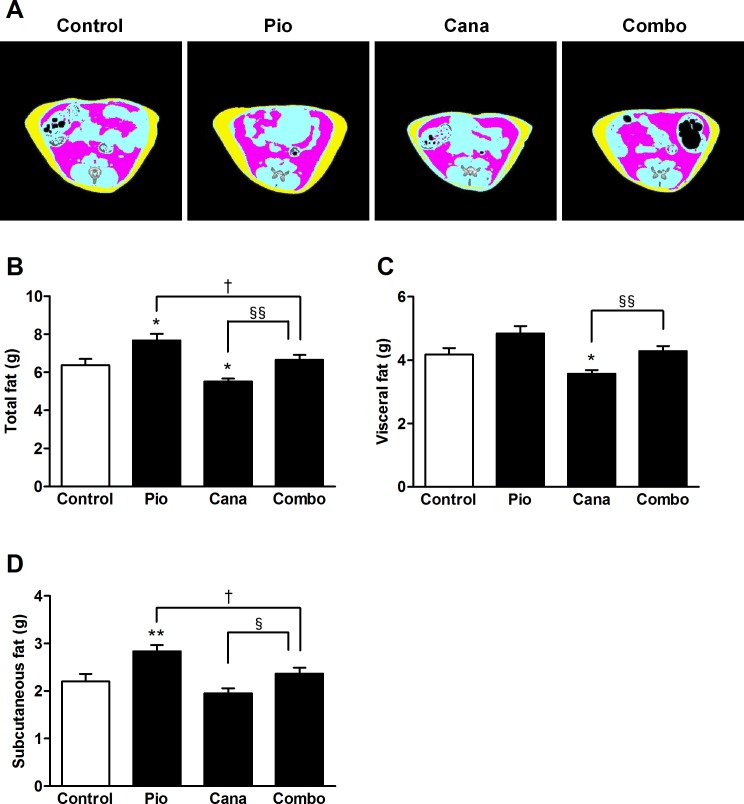
Figure 3. Body fat analysis by computed tomography (CT) in KK-Ay mice.
A: Representative CT images (red, visceral fat; yellow, subcutaneous fat), B: Total fat, C: Visceral fat, and D: Subcutaneous fat. Canagliflozin (Cana; 0.01% w/w food admixture), pioglitazone (Pio; 0.01% w/w food admixture), and their combination (Combo) were administered for 2 weeks. Adipose tissue weight was measured at the end of the study using an experimental animal CT system. Data are expressed as mean ± SEM (n = 7–8). * P < 0.05, ** P < 0.01 vs. control, † P < 0.05 vs. Pio, § P < 0.05, §§ P < 0.01 vs. Cana.

