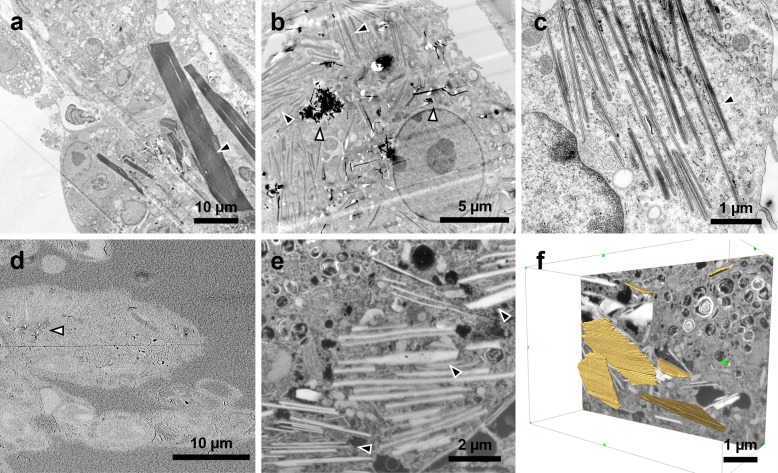
Figure 3. TEM (a-c) and SEM (d-f) images of crystalline bodies observed on day 28 in CNTLarge samples.
(a) Low magnification TEM image showing large crystals, some up to 40 μm long. (b) Image showing scattered crystalline bodies and CNTs in clusters. (c) Ordered crystalline bodies in the cytosol. (d) SEM image of the ultramicrotomed block revealing the underlying cells prior to milling. The image also shows a few protruding CNTs (white arrowhead) [27]. (e) FIB-SEM image of crystals in a cell. (f) 3D representation of the FIB-SEM stack where a few of the crystals have been traced (yellow), revealing their plate-like structure. Black arrowheads indicate ECP crystals while white arrowheads indicate the CNTs.

