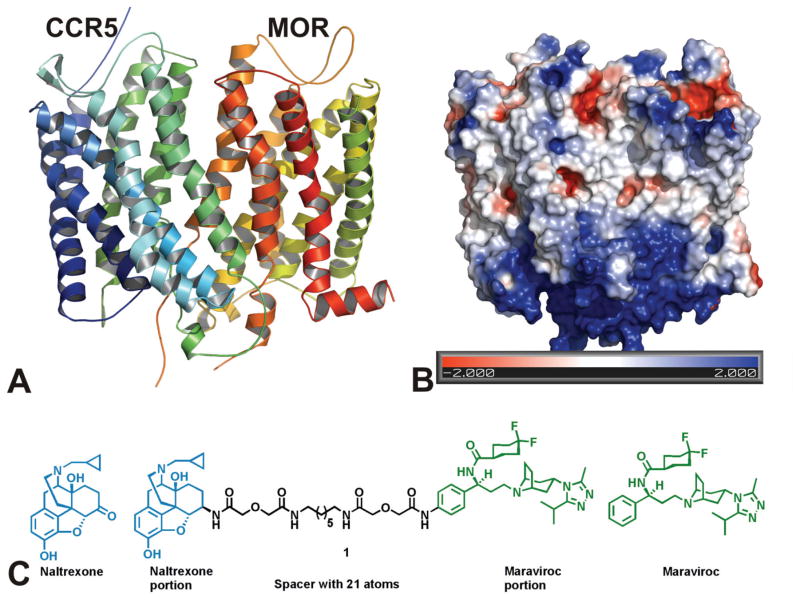
Figure 3.
Computer-generated model of a MOR-CCR5 dimer (A). The helical portions colored in blue and green represent CCR5, while the red and yellow helices represent MOR (A). Each ribbon was given an arbitrary color in order to distinguish individual helices from one another (A). Representation of the Poisson–Boltzmann electrostatic potentials at the surface of the heterodimer using the APBS plugin by PYMOL (El-Hage et al., 2013) (B). Acidic residues are shown in red (−2 kBT/e); basic residues are shown in blue (+2 kBT/e); white represents uncharged residues (B). The model predicts that a majority of the interactions between the two receptors are hydrophobic (B). Chemical structure of a bivalent ligand that binds both MOR and CCR5 receptors concurrently (C) (for complete description see, El-Hage et al., 2013). Reprinted with permission from Lippincott Williams and Wilkins/Wolters Kluwer Health: AIDS (El-Hage et al.), copyright 2013.

