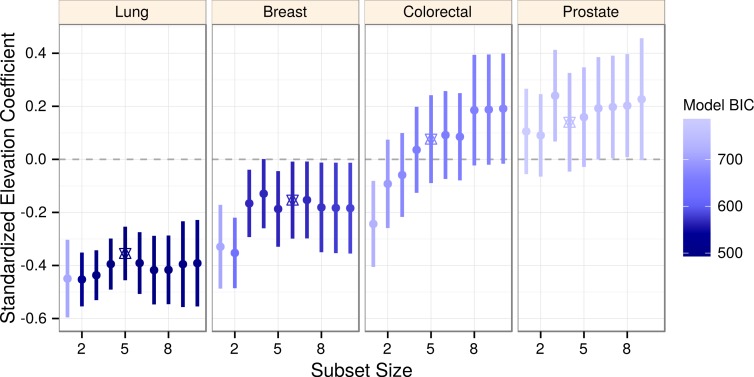
Figure 2. Elevation negatively associates with lung cancer incidence across a range of models.
Elevation coefficients and 99% confidence intervals are plotted across a range of best subset model sizes for each cancer. As determined by BIC, more likely models are shaded darker. The optimal (BIC-minimizing) model for each cancer is denoted by a star. Lung cancer is the only cancer to display consistently negative coefficients and confidence intervals.

