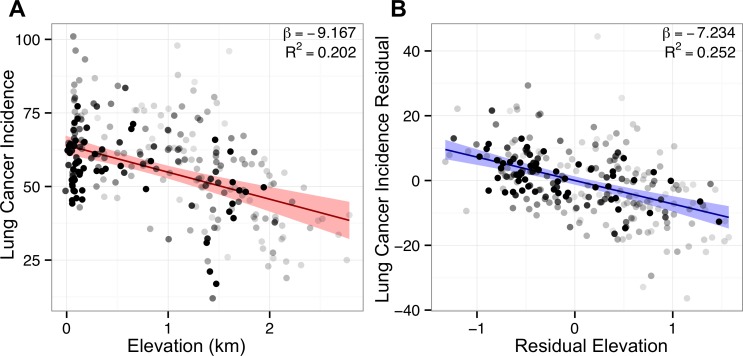
Figure 4. Adjustment for covariates sharpens lung cancer’s association with elevation.
Points represent counties shaded by their regression weight based on population. Bivariate (red) and partial (blue) regression lines are displayed with 99% confidence bands. (A) Bivariate plot of county lung cancer incidence (age-adjusted per 100,000) and elevation (km). (B) Partial regression plot for elevation based on the optimal best subset lung model. Association sharpens after adjustment for covariates, illustrated by the tighter confidence band and higher R2 in the partial plot.

