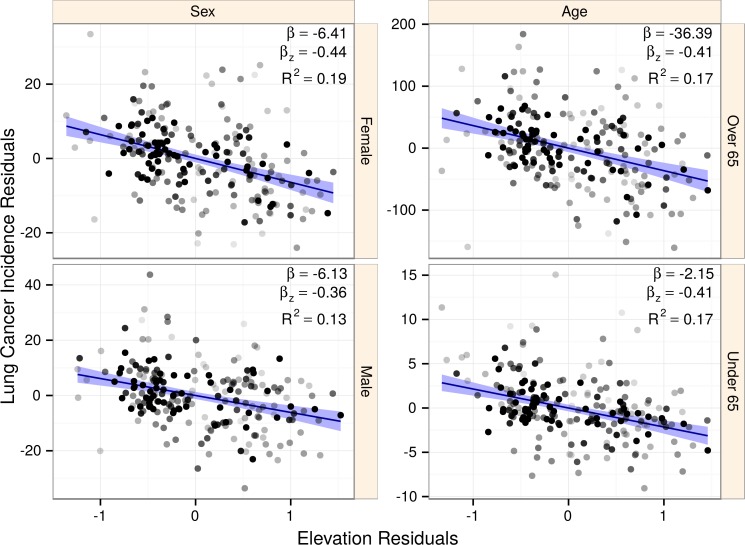
Figure 6. The association of elevation with lung cancer is consistent across population subgroups.
Points represent counties shaded by their regression weight based on population. Partial regression plots are displayed for each subgroup with 99% confidence bands. Subgroups displayed similar strongly negative elevation associations, indicating that our findings were not the result of sex or age-based confounding. The elevation coefficient, standardized elevation coefficient, and partial R2 are listed for each partial regression.

