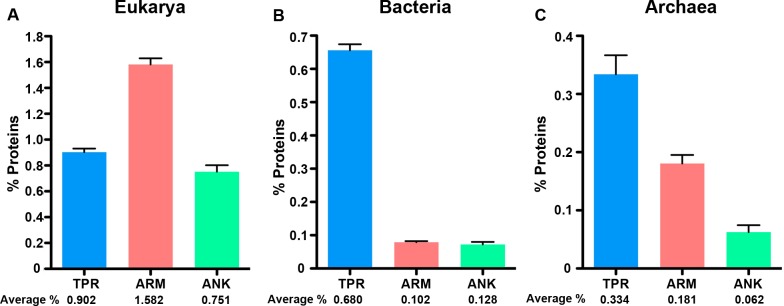
Figure 2. ANK, TPR, and ARM-containing proteins analysis across all domains of life.

Bar graphs of the average percent of the species in the domains. An average percent of ANK, TPR, or ARM-containing proteins for all organisms of the same species was used for these analyses. (A) Eukarya, (B) Bacteria, and (C) Archaea that have one or more ANK, TPR, and ARM-containing proteins. The average percent of protein domain composition is listed below the graph. (A) Mann Whitney U-test p < 0.0001 for all comparisons, ANOVA p = 5.79E-40. (B) Mann Whitney U-test p < 0.0001 for all comparisons, ANOVA p = 2.3E-203. (C) Mann Whitney U-test, p < 0.005 for all comparisons, ANOVA p = 9.85E-07. Error bars represent standard error.
