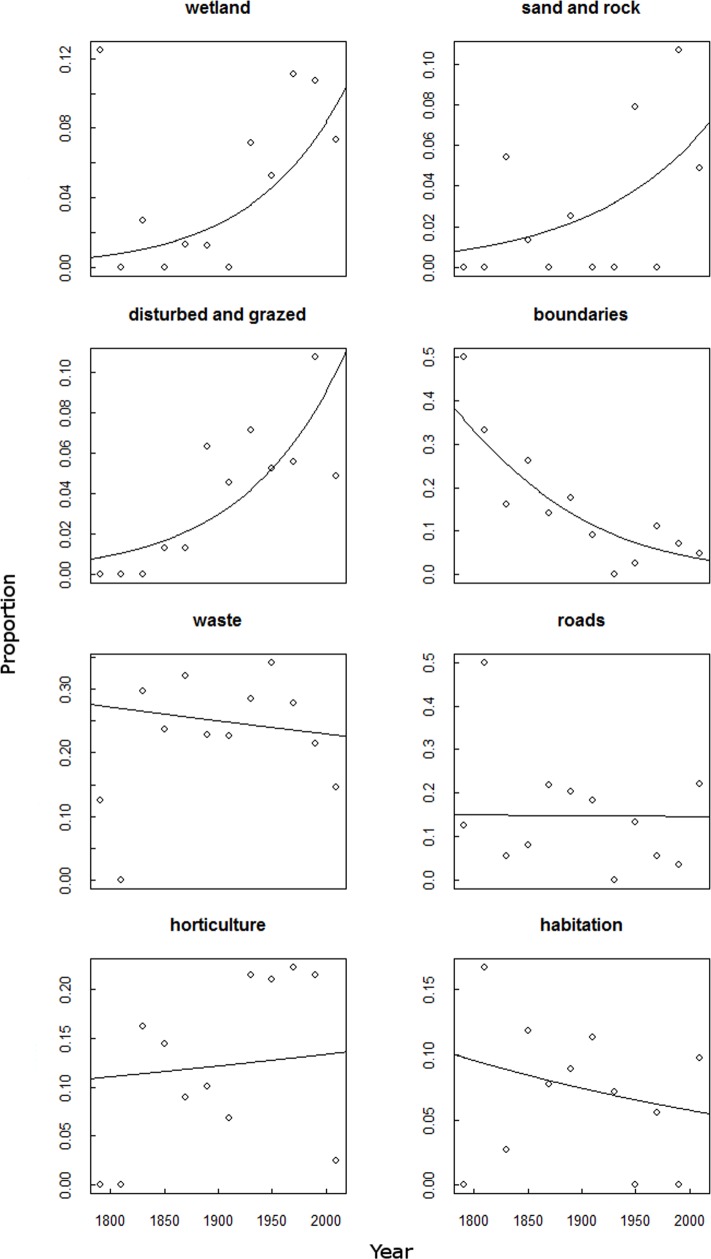
Figure 2. The change with time of habitat categories from the collected corpus of Chenopodiumvulvaria habitat descriptions.
A temporal analysis of the corpus of habitat descriptions from publications and specimens of Chenopodium vulvaria. The graphs show the proportion of token usage related to each habitat category for periods of 20 years. The words contributing to each habitat category are listed in Table S3. The best fit lines are from generalised linear models of the data weighted with the number of tokens contributing to each proportion. The categories wetland (P < 0.01, DF = 11), sand and rock (P < 0.05, DF = 11), and disturbed and grazed (P < 0.05, DF = 11) all significantly increased with time. Only the term boundaries decreased with time (P < 0.001, DF = 11). All other categories shown in Fig. 1 did not show significant variations with time.

