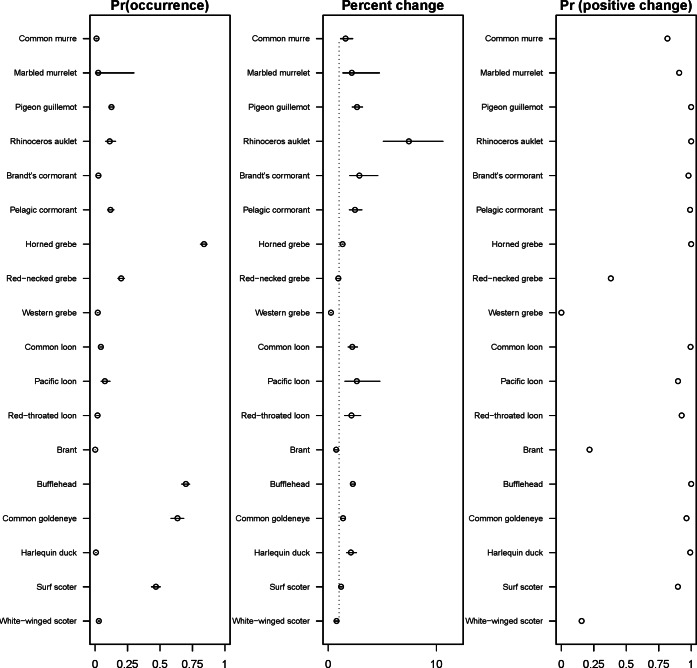
Figure 8.
Estimated probability of occurrence in the 2013–2014 seabird survey (with 25%, 50%, 75% intervals), percent change in the probability of occurrence from 2007 to 2013 (25%, 50%, 75% intervals), and the probability of the annual rate of change from 2007 to 2013 has been positive. All data (2007–2013) are used to estimate intra- and inter-annual trends.

