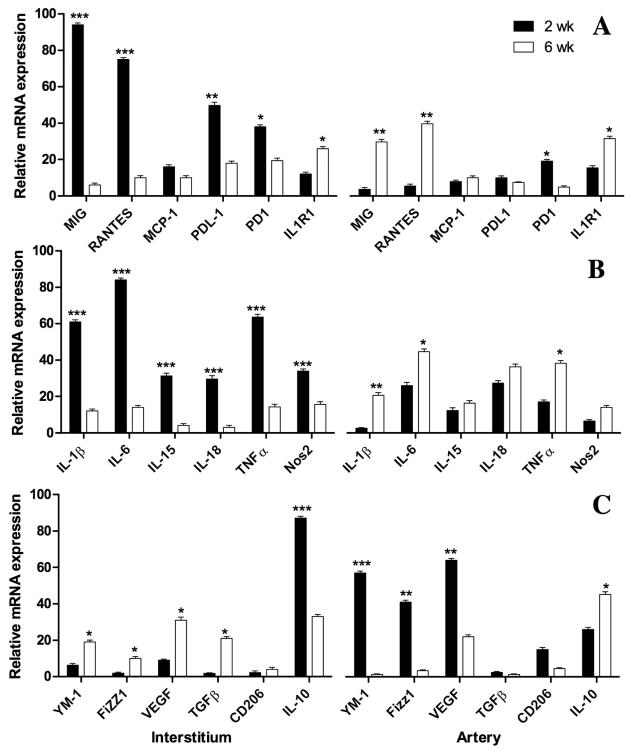
Figure 3.
Quatitative PCR on 3 microdissected allografts at 2 and 6 weeks expressed as fold change relative to isografts from the same time points. Confirmation of key cytokines, receptors and ligands from the initial PCR array (A). Markers for M1 inflammatory macrophages are consistently higher in the interstium (left panel) at 2 weeks (filled bars) than at 6 weeks (open bars), whereas in the arterial compartment (right panel) the these markers are low at 2 weeks and increase by 6 weeks (B). In contrast, the converse occurs for markers of M2 wond healing macrophages with the exception of IL-10 (C). Error bars represent standard errors of the mean of 3 allografts. Differences between 2 and 6 week values were significant at the P<0.05*; <0.01**; or <0.001*** level as indicated.

