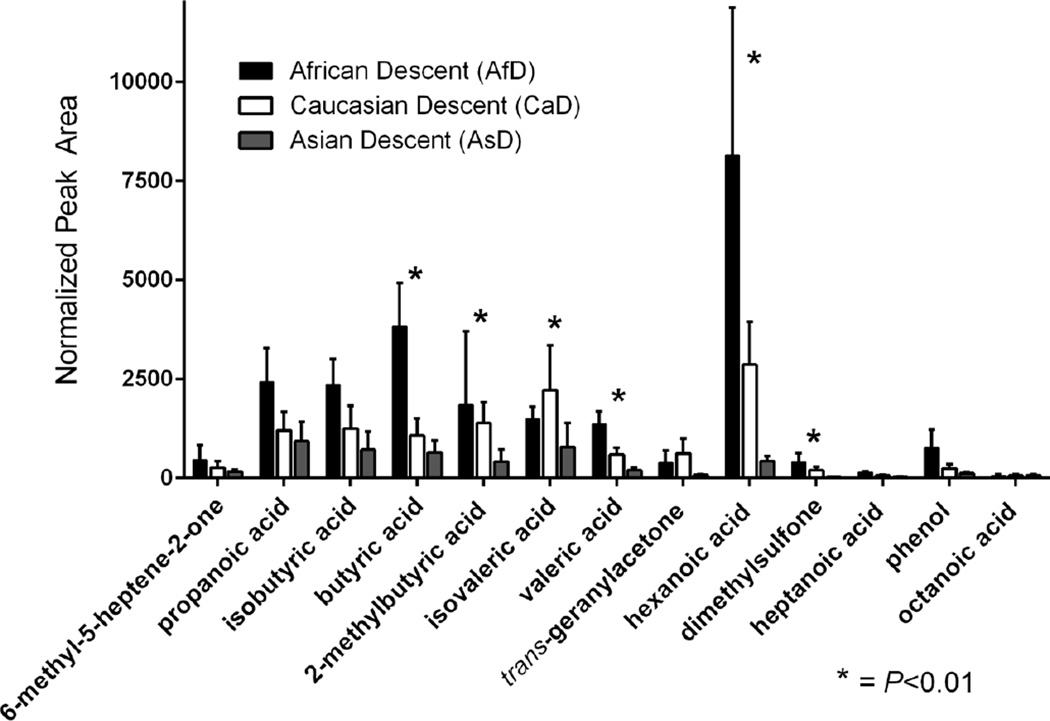
Fig. 3.
Comparison of volatile organic compounds (VOCs) from the headspace of cerumen samples from individuals of African (AfD) (N = 10, black), Caucasian (CaD) (N = 11, white), and Asian (AsD) (N = 11, gray) descent averaged over three sample collections. Acetic acid (not shown because of scale) was elevated in subjects of AfD (39,935 ± 12,579 [s.e.]) compared to CaD (11,453 ± 6,055) and AsD (5,317 ± 2,182), and varied significantly across groups (P=0.004). Error bars represent standard error. Asterisks denote compounds that vary significantly (P<0.01) across ethnic groups. Note that within the homozygotic C:C donors, CaD produced significantly more isovaleric acid.

