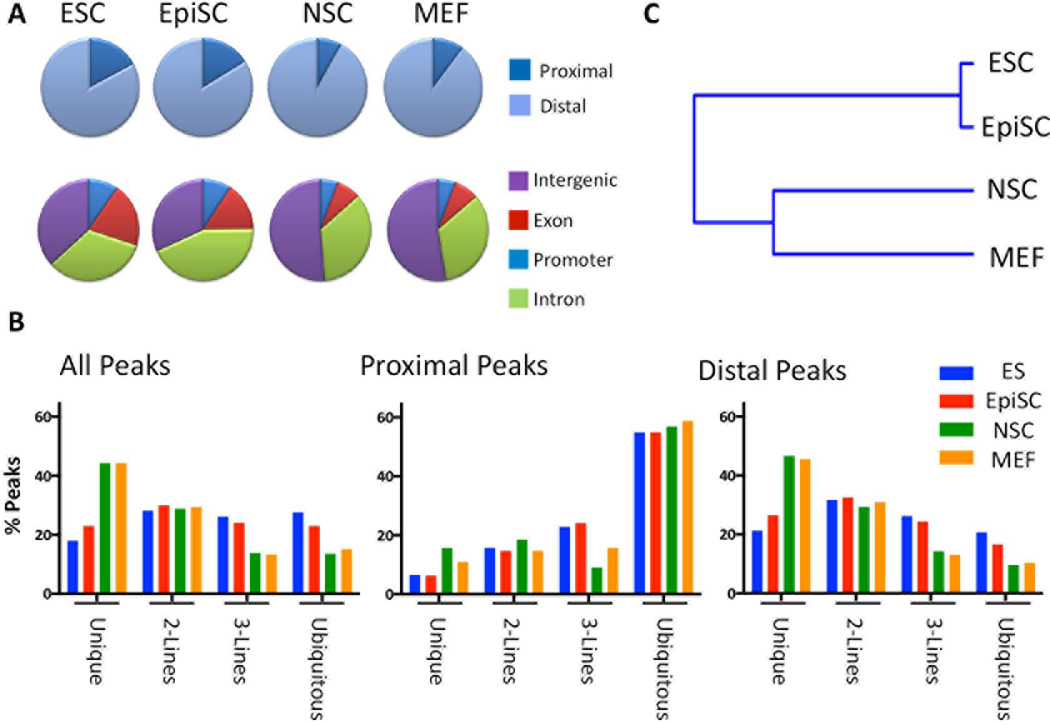
Figure 1. FAIRE-seq reveals an overall distinction in the chromatin structure of pluripotent- and non-pluripotent cells.
A) Pie charts depicting the genomic distribution of FAIRE peaks in each cell line with respect to annotated transcription start sites (TSSs, Proximal= ± 2 kb from an annotated TSS; Distal ≥ 2kb from a TSS), or that map to genomic regions corresponding to Promoters, Exons, Introns, or Intergenic regions. B) Percentage of FAIRE sites from each cell line (enrichment score ≥ 5) that overlaps sites in one or more of the other cell lines. This analysis was performed comparing all FAIRE sites for each cell line (All peaks, Left panel), and was separately performed for those mapping Proximal to a TSS (Proximal peaks, Center panel), or distal to a TSS (Distal peaks, Right panel). The percentage of peaks that is common to all four cell lines (Ubiquitous), common to three cell lines (3 lines), two cell lines (2 lines), or specific to each cell type (Unique) is shown for each cell type. C) Hierarchical clustering of FAIRE sites among the cell lines shows the close relatedness of the chromatin structure of ESCs and EpiSCs, and their segregation from that of NSCs and MEFs.

