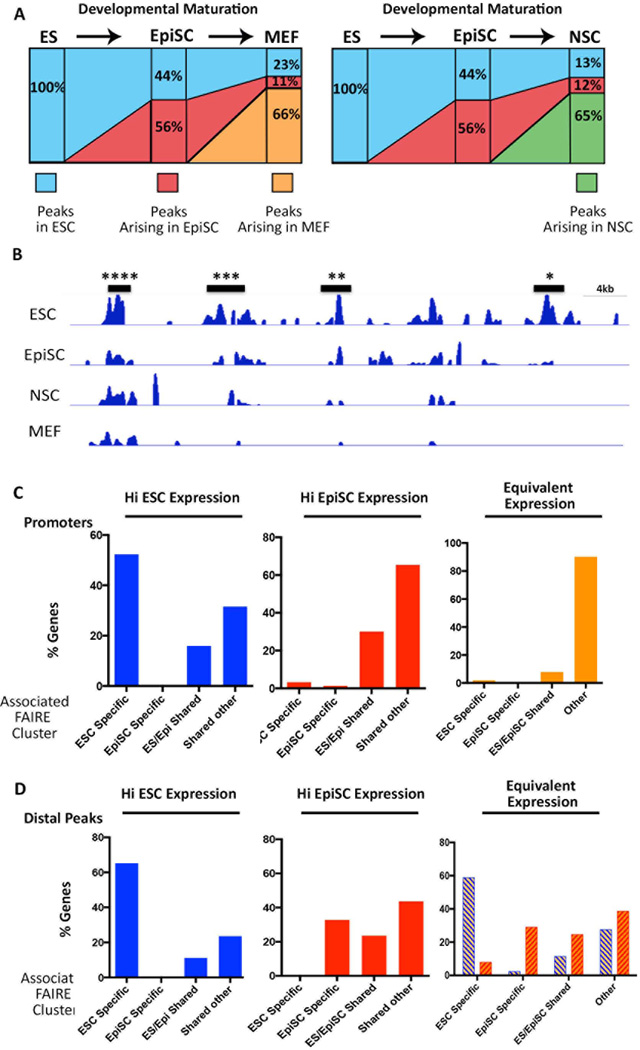
Figure 2. Changes in FAIRE peak distribution model developmental transitions.
A) Model for changes to the chromatin landscape upon differentiation. Each column represents 100% of the FAIRE sites for the cell line indicated on top. The percentage of sites overlapping a FAIRE site in the ‘progenitor’ (cell line to the left) is shown. Sites not overlapping sites in the progenitor were designated as newly acquired accessible regions (Arising). B) FAIRE peaks clusters at putative regulatory DNA elements. A segment of the mouse genome showing clusters of ESC FAIRE peaks that are common to all cell lines (****), shared with 2- (***)- or 1 other line (**), or are ESC-specific (*). C) Determination of the type of FAIRE cluster (ESC-specific, EpiSC-specific, ES/Epi shared, or shared between 2 or more cell types (other)), that is associated with promoters of the top 1000 differentially genes in ESCs and EpiSCs. Each panel depicts the analysis for the gene set indicated at the top, i.e. genes more highly expressed in ESCs (HI ESC Expression), EpiSCs, (HI EpiSC Expression), or Equivalently expressed in the two cell lines. In each case, the number of promoters associated with each type of FAIRE cluster was determined. D) The type of distal FAIRE clusters (>2kb<100 kb from the TSS) that is associated with the same sets of genes analyzed in (C). Interestingly, genes that are equivalently expressed in ESCs and EpiSCs are associated with distinct distal accessible regions in ESCs and EpiSCs (blue- or orange hash marks, respectively).

