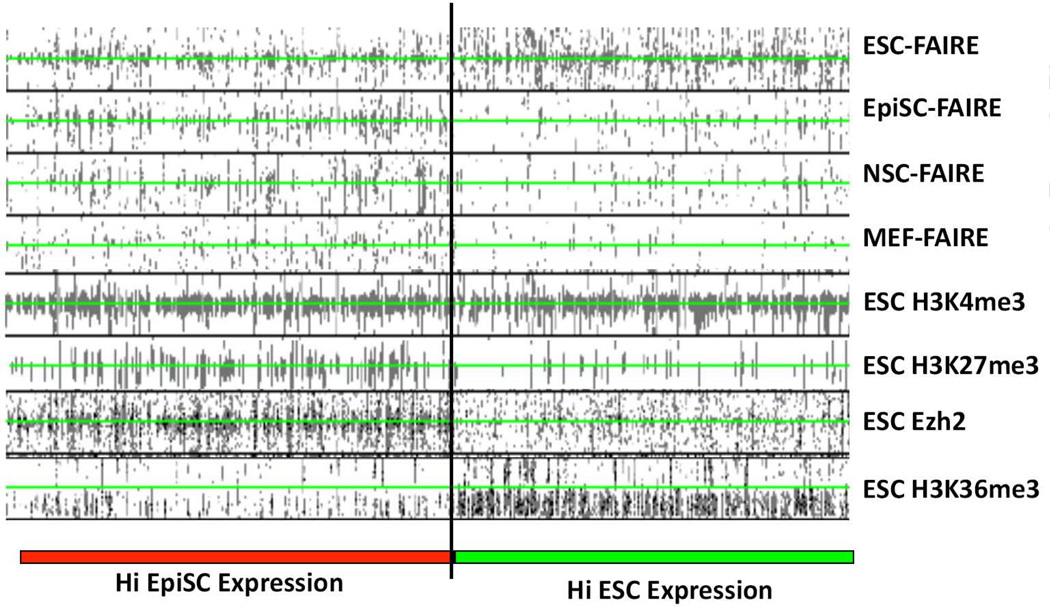
Figure 3. Accessible chromatin patterns and ESC Histone modifications at the promoter regions for differentially expressed genes in ESCs and EpiSCs.
Density plots showing the relationship of the top 1000 differentially expressed genes between ESCs and EpiSCs with FAIRE sites in all four cell lines, and ESC ChIP-seq data for H3K4me3-, H3K27me3-, H3K36me3 modified nucleosomes, or Polycomb Complex component Ezh2 [14, 15]. Genes were ranked according to their expression in ESCs and EpiSCs according to the microarray data of [13] (genes more highly expressed in ESCs, HI ESC Expression, demarcated by green bar; genes more highly expressed in EpiSCs, HI EpiSC Expression, demarcated by red bar). Read densities for FAIRE and ChIP data are shown in black. The TSS for each gene analyzed is centered at the green line of each column. Read densities for each feature indicated at the top of the column is shown for a 5 kbp region flanking each TSS.

