
Fig. 4. Adaptation of NMDA-evoked [Ca2+]i responses following Tat-induced potentiation requires remodeling of the actin cytoskeleton.
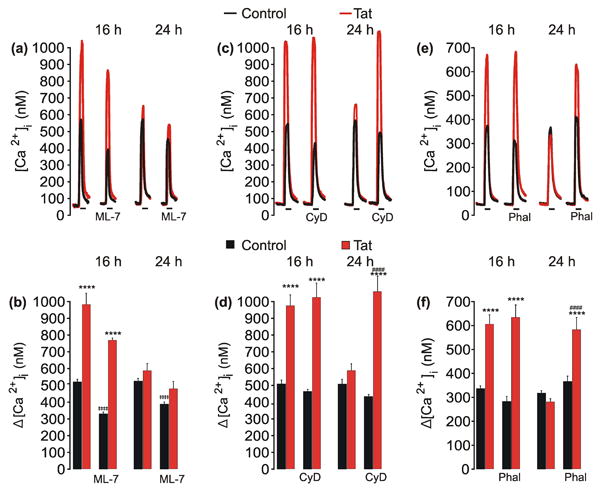
a, c, e, representative traces show NMDA-evoked [Ca2+]i increases from control (
 ) neurons or neurons treated with 50 ng/mLTat (
 ) for 16 h or 24 h. Cells were pretreated with ML-7 (10 μM), Cytochalasin D (CyD, 1 μM), or Phalloidin (Phal, 1 μM) for 1 h prior to the addition of Tat. NMDA (10 μM, 30 s) was applied by superfusion at the times indicated by the horizontal bars. b, d, f, bar graphs show net [Ca2+]i increase evoked by 10 μM NMDA in control (
 ) cells or cells treated with Tat (
 ) for 16 h or 24 h. Cells were pretreated with ML-7, CyD, or Phal as indicated. ****p<0.0001 relative to respective control; ‡‡‡‡p<0.0001 relative to untreated control with same treatment time; ####p<0.0001 relative to 24 h Tat-treated neurons as determined by separate, one-way ANOVAs with 4 levels per treatment time followed by Tukey's post-test for multiple comparisons.