
Fig. 5. Polymerization or depolymerization of the actin cytoskeleton reduces NMDA-evoked [Ca2+]i responses.
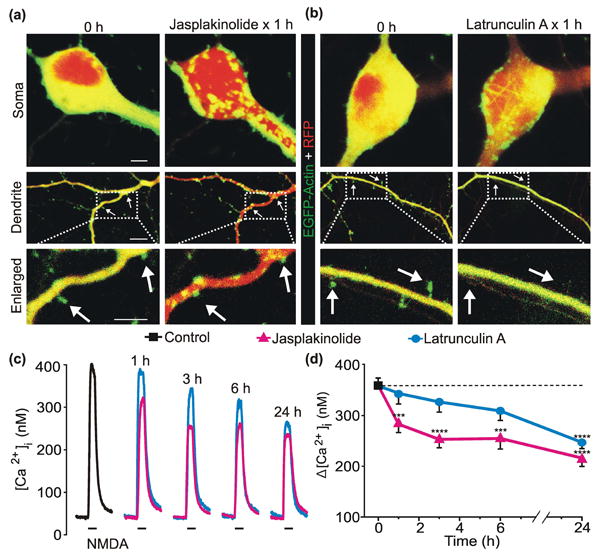
a, b, Representative confocal images (Scale bar = 10 μm) of neurons expressing EGFP-Actin and Tag-RFP before (0 h) and after 1 h treatment with 10μM Jasplakinolide (a) or 5 μM Latrunculin A (b). Compressed z-stacks of red (Tag-RFP) and green (EGFP-Actin) images were superimposed. c, representative traces show NMDA-evoked [Ca2+]i increases from control (
 ) neurons or neurons treated with 10 μM jasplakinolide (
 ) or 5 μM latrunculin A (
 ) for the times indicated above the traces. NMDA (10 μM, 30 s) was applied by superfusion at the times indicated by the horizontal bars below the traces. d, plot summarizes time-dependent changes in NMDA-evoked [Ca2+]i increases from control (
 ) neurons and neurons treated with 10 μM jasplakinolide (
 ) or 5 μM latrunculin A (
 ).***p<0.001, ****p<0.0001 relative to control as determined by separate, one-way ANOVAs with 5 levels per treatment followed by Tukey's post-test for multiple comparisons.