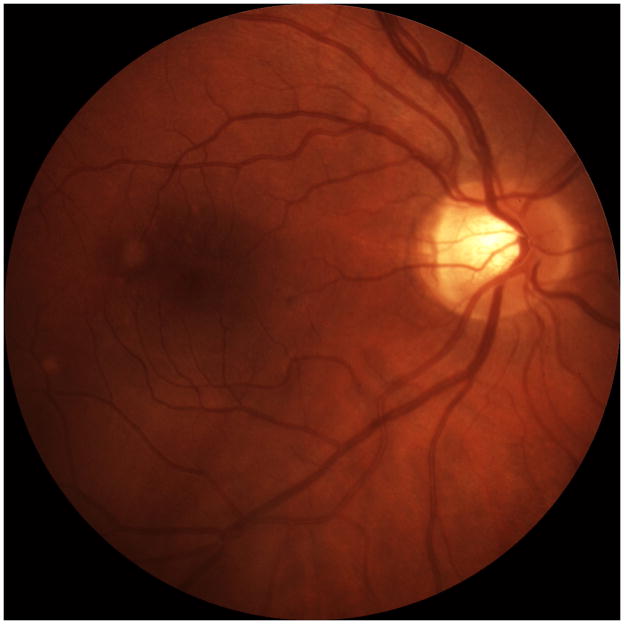
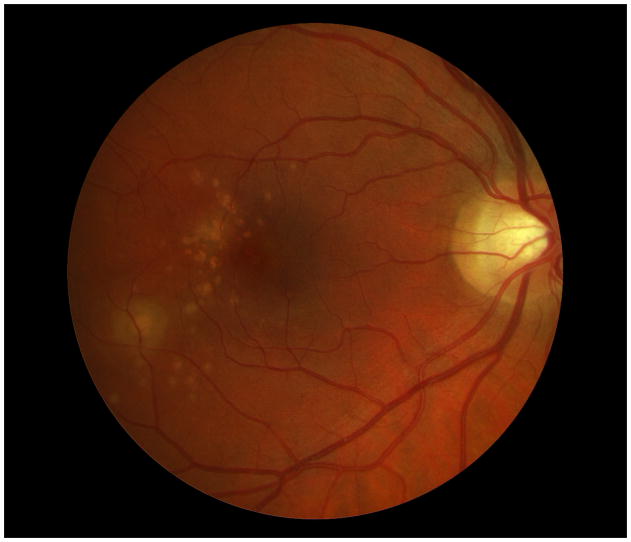
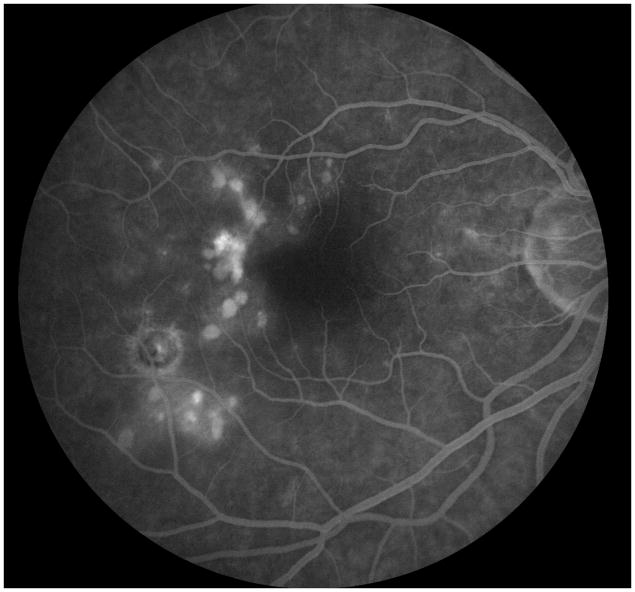
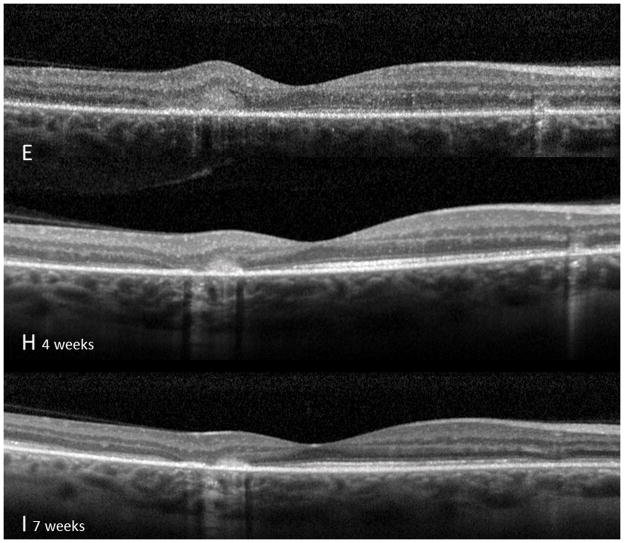
Figure 2. Case 2.
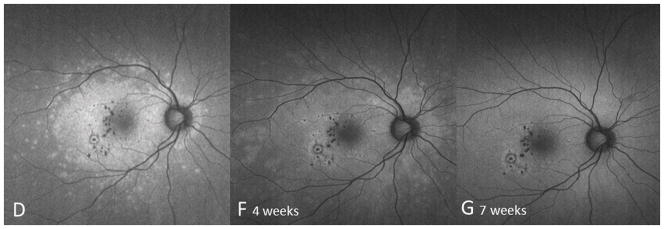
Color fundus image (A) of the right eye reveals yellowish circumscribed chorioretinal lesions temporal to the fovea. Best corrected visual acuity (BCVA) was 20/20 One year later the patient presents with sudden visual acuity loss down to hand motion (HM) (B): There is a visible increase in the size and number of yellowish creamy chorioretinal lesions within the macula. Fluorescein angiography (FA) (C) shows staining and some mild late leakage. The inferotemporal hypofluorescent lesion is surrounded by a subtle hyperfluorescent ring suspicious for a possible inactive choroidal neovascular membrane. Near infrared (787nm) (D) fundus autofluorescence (FAF) is remarkable for a distinctive area of hyperautofluorescence throughout the posterior pole. The spectral domain optical coherence tomography (SD-OCT) scan (E) has extensive loss of the external limiting membrane (ELM), ellipsoid and interdigitation zones. The retinal pigment epithelium is thinner and less reflective. Near infrared (787nm) FAF (F+G) highlights the decrease in hyper-autofluorescence over the next two months. The chorioretinal lesions corresponding to hypoautofluorescent spots on FAF have decreased in number as well as in size. Correspondingly, SD-OCT (H+I) shows partial restoration of the ELM and ellipsoid zones. Hereby the respective bands remain attenuated and less hyperreflective and the photoreceptor-complex and the outer nuclear layer appears significantly thinner when compared to the non-affected fellow eye. The interdigitation zone is not distinguishable. The BCVA remains HM.

