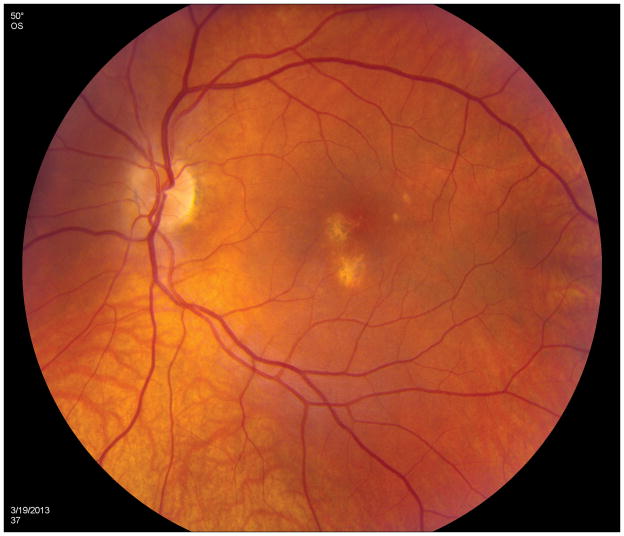
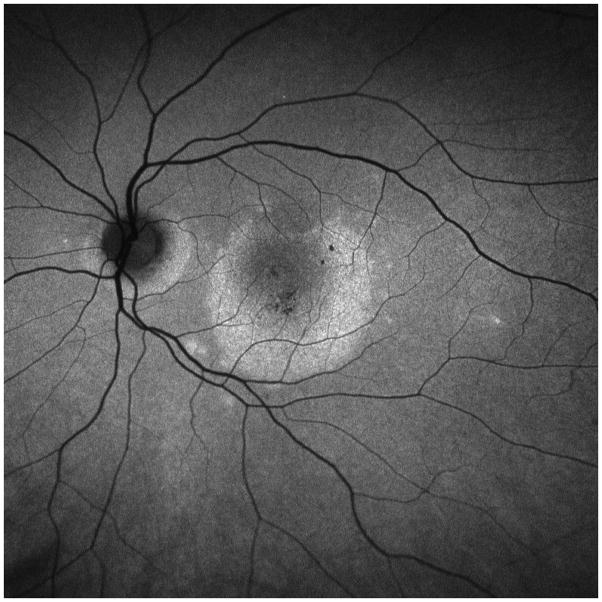
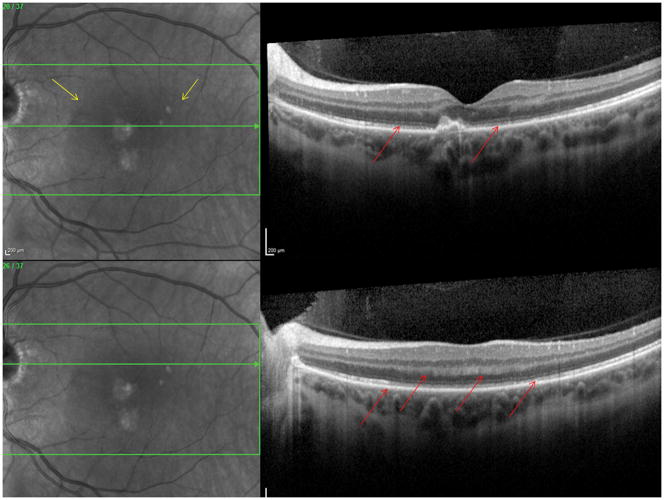
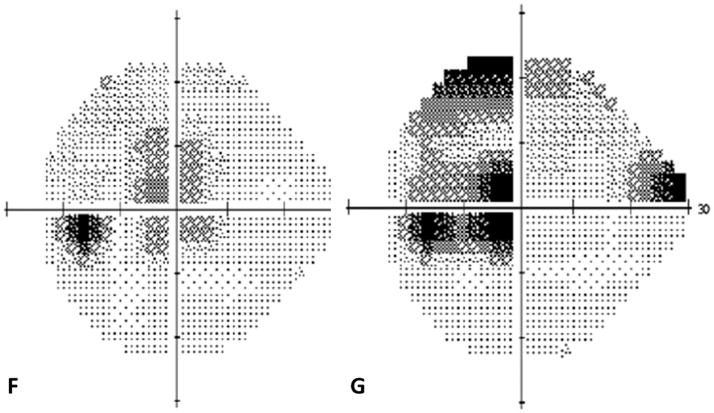
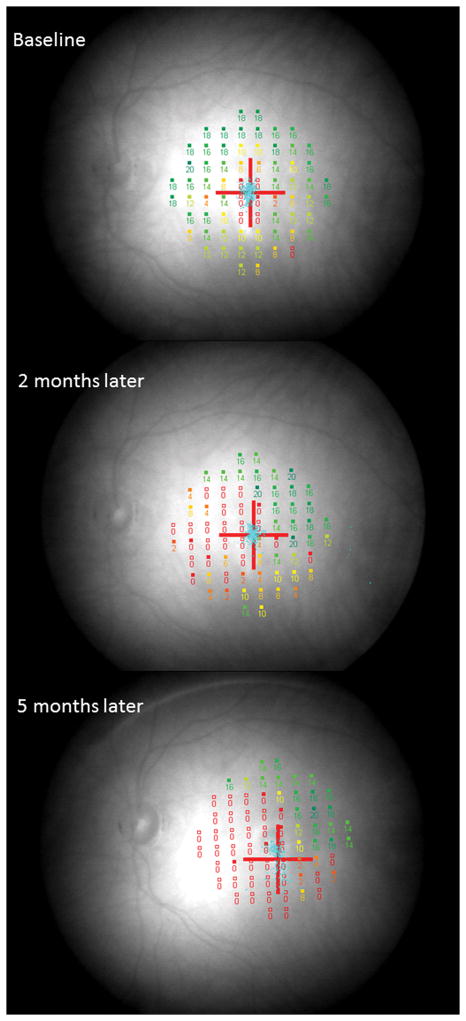
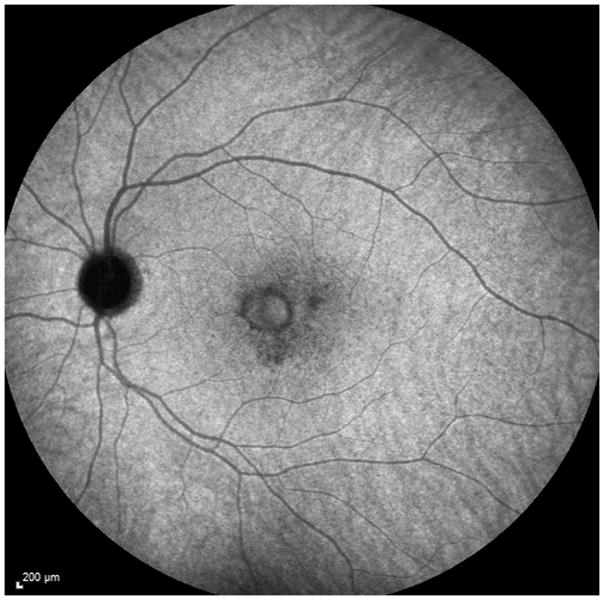
Figure 4. Case 4.
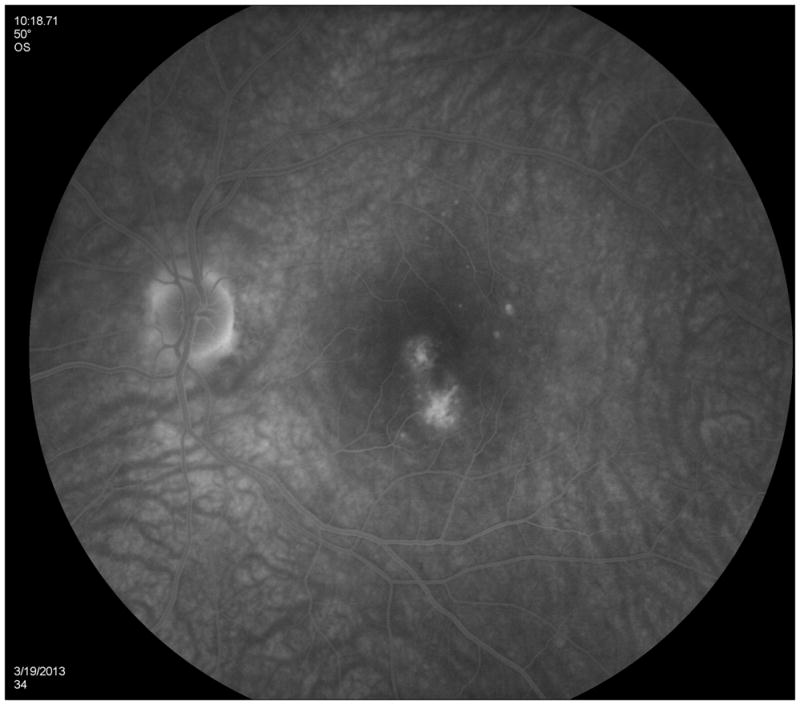
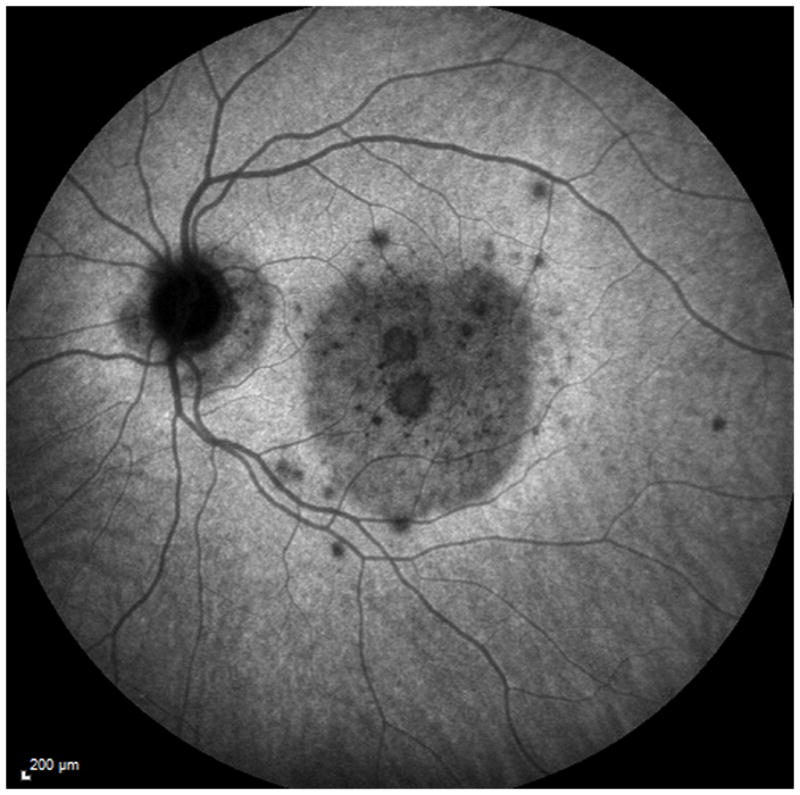
Color photographs of the left eye (A) reveals peripapillary atrophy, 2 large yellow parafoveal chorioretinal lesions and 3 smaller lesions superior to the fovea. Fluorescein angiography (FA) (B) identifies window defects and late staining of the chorioretinal lesions. Indocyanine green angiography (ICGA) highlights (C) the hypofluorescent lesions but also has a plaque-like hypofluorescent area which corresponds to the hyper-autofluorescent area seen with near infrared- (787nm) autofluorescence (FAF) (D): Near infrared-FAF outlines the clear ring-shaped hyperautofluorescence visible around the optic disc and around the fovea. Corresponding spectral domain optical coherence tomography (SD-OCT) changes (E) include an indistinct external limiting membrane (ELM), ellipsoid and interdigitation zones adjacent to the chorioretinal lesions and a hyperreflective Henle’s layer, which seems to correspond to the hypofluorescence on ICGA (red arrows). Corresponding to the hyperreflectivity in the Henle’s layer, the hyperreflectivity of the ELM, ellipsoid and interdigitation zones is further attenuated (red arrows). There is also hyporeflectivity on the IR imaging visible (yellow arrows) corresponding to the hypofluorescence on ICGA and the hyperautofluorescence with near infrared FAF. The visual field (F) defect corresponds to the area of hyperautofluorescence. Two months later: The hyperautofluorescence has decreased in intensity but the visual field defect (G) as well as the central scotoma (H) has increased in size. Five months later: The hypofluorescence on ICGA has faded (I) but the absolute scotoma has continuously grown in size (H)

