
Figure 1.
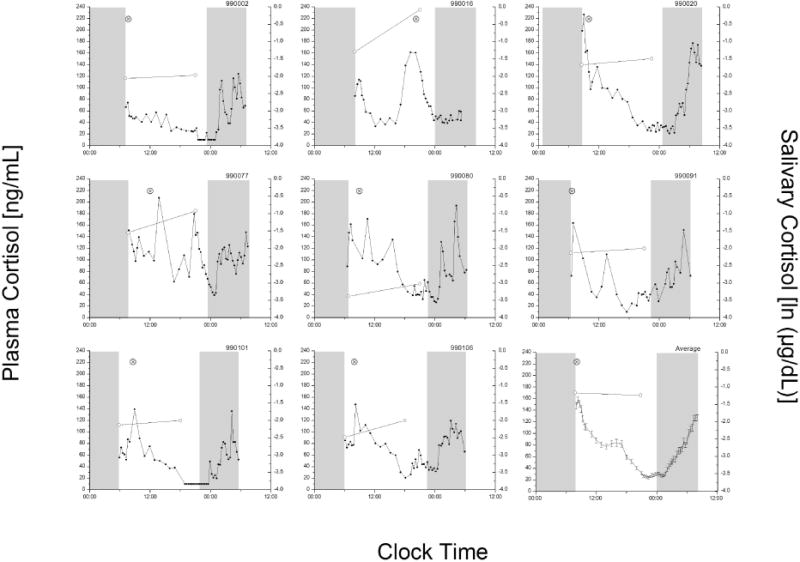
Individual plots of participants with positive diurnal salivary cortisol slopes. Each panel (except the lower right) has data collected during the protocol for the eight participants with positive slopes. The average ± SEM curves for the remaining available participants (n=75) is shown in the lower right panel. The cortisol concentration for each plasma sample (left y-axis, solid circles) and saliva sample (right y-axis, open circles) is plotted at the precise time of collection (wake and 9PM). The grey boxes represent the timing of lights-off when sleep was permitted. Circadian phase (⊗, peak of the first harmonic of the three-harmonic fit) is plotted for each participant.