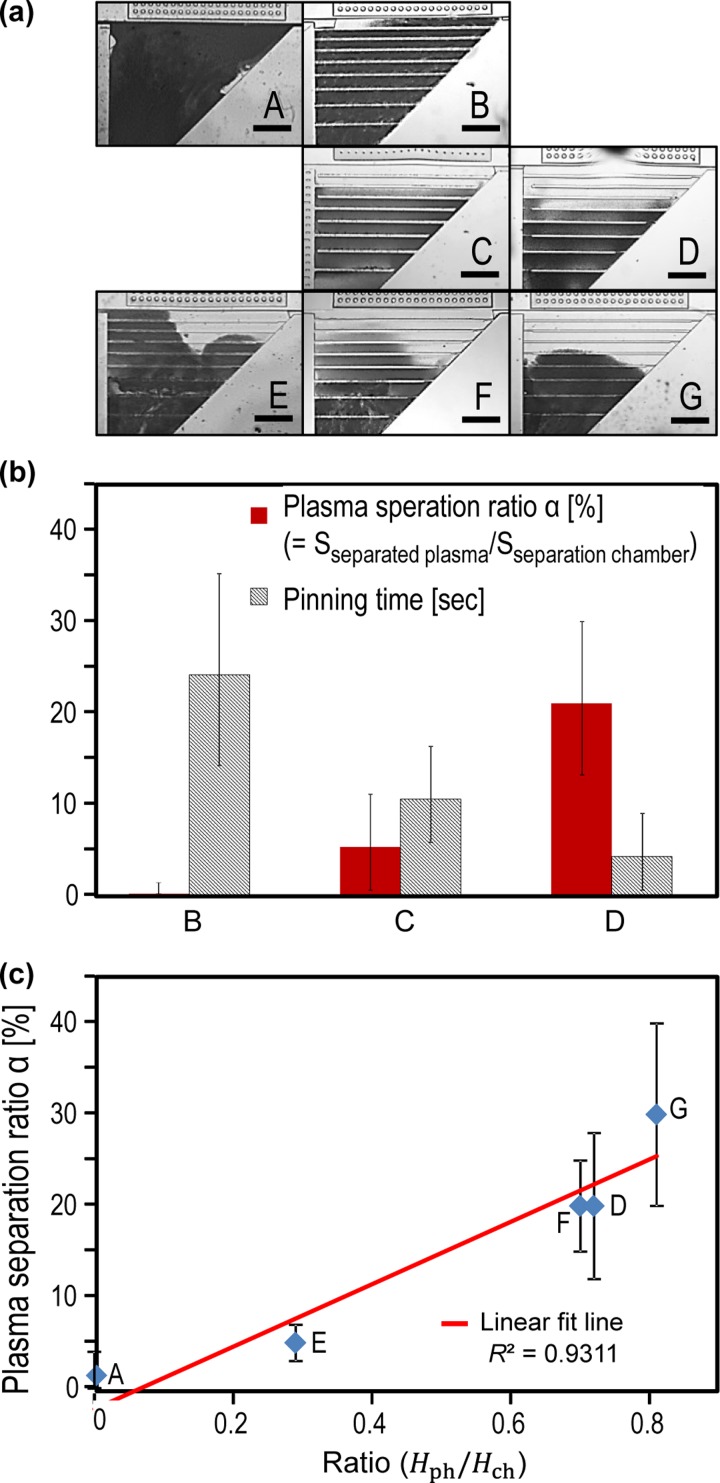
FIG. 3.
Experimental results of the devices in case I. (a) Device A, B, C, D, E, F, and G after the filling process in the separation chamber. (b) Effect of the pinning time on the blood plasma separation ratio (α) based on device B, C, and D. (b) Effect of the ratio between the height of phaseguides and the separation chamber on the blood plasma separation ratio (α) based on device A, D, E, F, and G. The linear fit line is plotted in red colour. Blue diamonds (⋄) stand for the experimental data. The error bar represents the standard deviation based on three tests. Scale bar is 1 mm.

