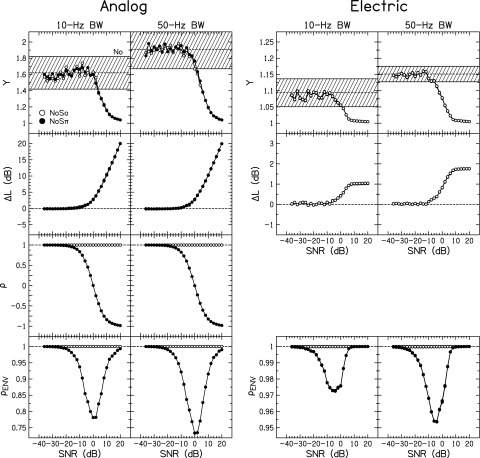
FIG. 4.
Calculation of the normalized kurtosis (Y), change in level (), waveform interaural correlation (), and interaural envelope correlation as a function of SNR for the analog stimuli and after transformation to electrical CUs. Open symbols show the average value for NoSo stimuli; closed symbols show the average value for NoSπ stimuli. The shaded region in the panels depicting Y shows the mean and ±1 standard deviation for No stimuli. Note that the electrical stimuli demonstrate smaller ranges of each stimulus metric compared to the analog panels. Data points for each CI listener using their particular DR are plotted in the electric panels but are not visible because DR only slightly changed the calculation of each metric. Calculations for the NoSπ stimuli were omitted from the electric Y and panels to improve visibility.

