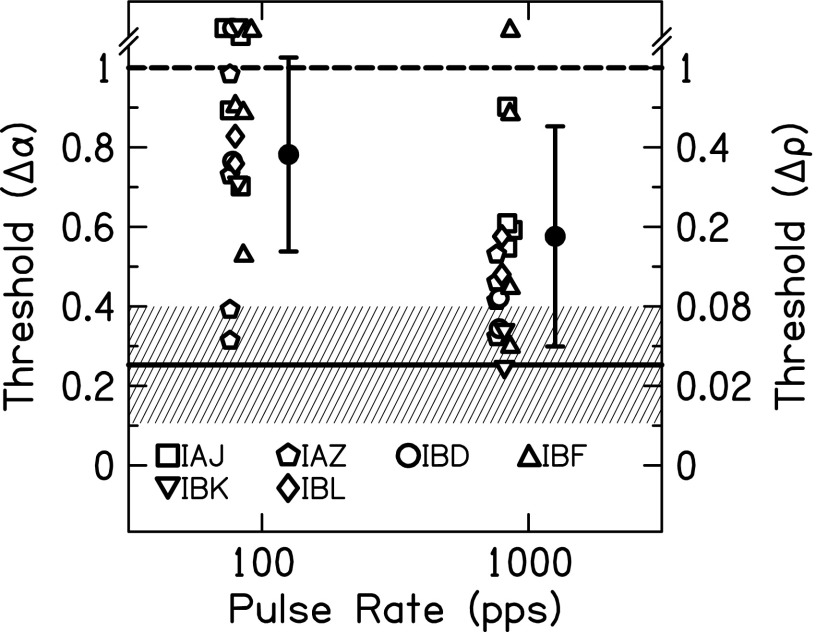
FIG. 6.
Envelope correlation change JNDs for = 1 non-targets as a function of pulse rate. Individual (open) and average (closed) JNDs are shown. Error bars represent ±1 standard deviation. The mean JND (solid line) and ±1 standard deviation (shaded area) for NH listeners presented a CI simulation are also shown.

