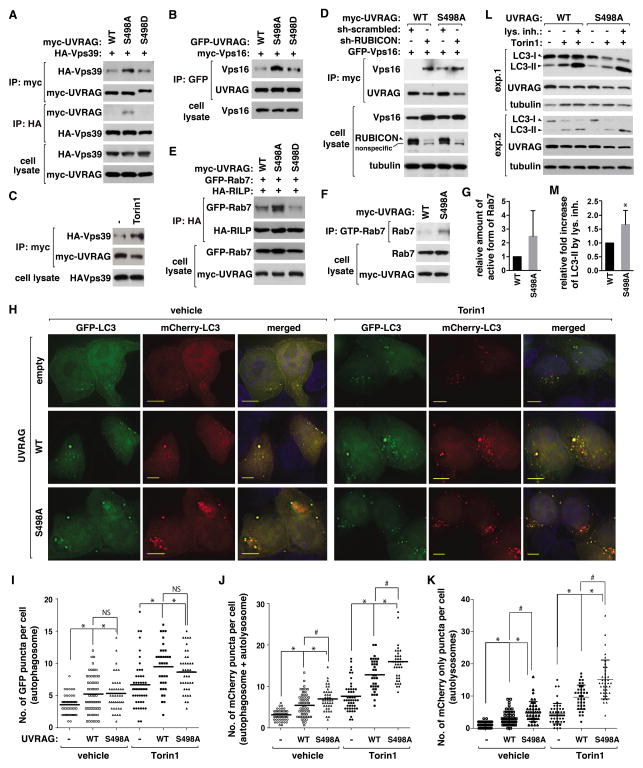
Figure 6. Prevention of UVRAG Ser498 phosphorylation facilitates autophagosome maturation.
(A) S498 phosphorylation negatively regulates the UVRAG-Vps39 interaction. HA-Vps39 was transiently expressed in UVRAG-reconstituted HEK293T cells, and their interaction was analyzed by immunoprecipitation and WB. (B) S498 phosphorylation negatively regulates the UVRAG-Vps16 interaction. Myc-Vps16 recovered with GFP-UVRAG IP from HEK293T cells was analyzed by WB. (C) Torin1 enhances the UVRAG-Vps39 interaction. HEK293T cells transiently expressing HA-Vps39 and myc-UVRAG were treated with Torin1 or vehicle (−). HA-Vps39 recovered with myc-UVRAG IP was analyzed by WB. (D) RUBICON knockdown enhances the UVRAG-Vps16 interaction in WT cells but not in S498A cells. GFP-Vps16 recovered with myc-UVRAG IP from shRNA-transduced HEK293T cells was analyzed by WB. (E) S498 phosphorylation negatively regulates the Rab7-RILP interaction. Rab7 recovered with HA-RILP from WT or mutant UVRAG-reconstituted HEK293T cells was analyzed by WB. (F) S498 phosphorylation negatively regulates Rab7. The GTP-bound Rab7 was detected as described in Experimental Procedures. (G) Quantitative analysis of (F). Data are means ± SD (n=2). (H) S498 phosphorylation negatively regulates autophagosome maturation. mCherry-GFP-LC3 was expressed in empty vector- or UVRAG-transduced HCT116 cells. Cells were treated with Torin1 or vehicle. LC3 was monitored by fluorescence microscope. Scale bar, 5 μm. (I and J) Quantitative analysis of GFP puncta (I) and mCherry puncta (J) (*, p<0.01 vs empty vector; #, p<0.01; NS; n≥35). Mean value is shown as a horizontal bar. (K) Quantitative analysis of mCherry only puncta (*, p<0.01 vs empty vector; #, p<0.01; n≥35). Mean and SD are shown as horizontal bars. (L) S498A mutation enhances autophagy flux. HEK293T cells reconstituted with UVRAG constructs were treated with Torin1 in the presence or absence of Bafilomycin A1 (exp1) or E-64/Pepstatin A (exp2). (M) Quantitative analysis of the fold increase of LC3-II level induced by the lysosomal inhibitors in Torin1-treated cells. Data are means ± SD (*, p<0.05; n=5). See also Figure S6.

