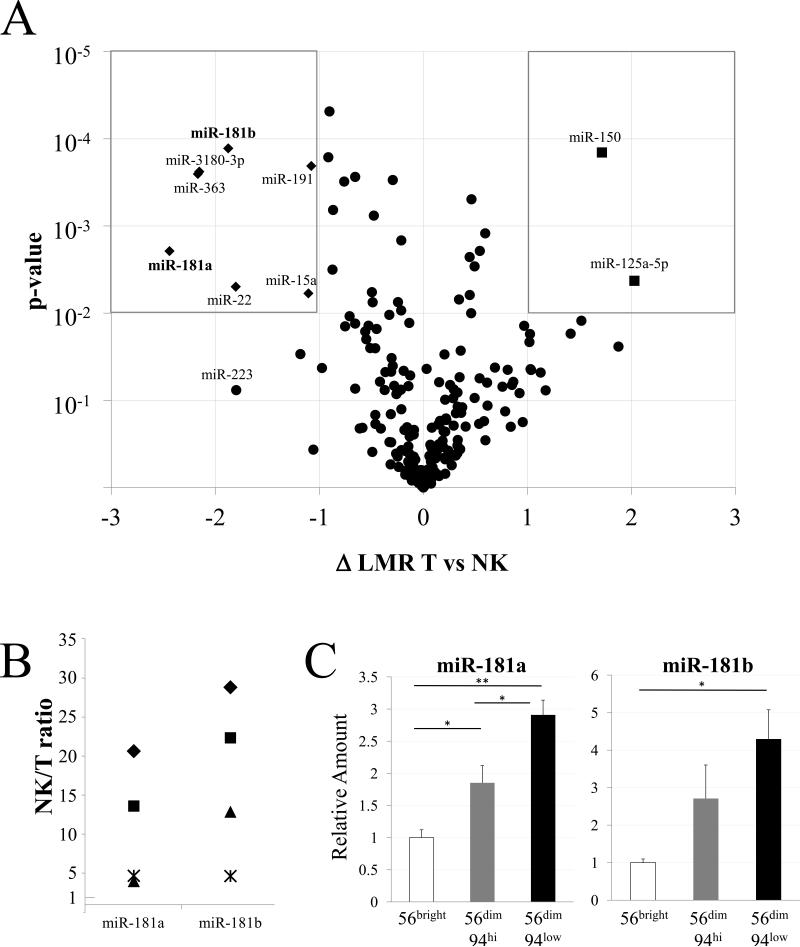
Figure 1.
Differential miRNA expression. A. miRNA expression in NK cells and T cells. The difference in Log2 Median Ratios (ΔLMR) between NK and T cell groups is shown on the x-axis against the significance of the difference (-Log10 p-value of two-tailed T-test, corrected with Bonferroni's post-hoc test) on the y-axis. miRNAs with log2 changes of >1 (higher in T cells) or <-1 (higher in NK cells) as well as high statistical significance (P<0.01) are displayed as squares when higher in T cells (upper right) and diamonds when higher in NK cells (upper left). Note that two diamonds largely overlap. Also indicated is miR-223. B. RT-qPCR data were normalized to RNU-24 levels and calculated as NK-to-T cell ratio (1 = no difference) for the miRNAs listed on the x-axis. NK and T cell RNA was analyzed from the three subjects studied above (represented as◆, ■ and▲) and from a fourth subject (represented as*). For each miRNA, T and NK cells differed significantly (p < 0.05). C. Differential miR-181a and miR-181b expression in NK cell development. The indicated NK subsets were sorted to >95% purity and the miRNA, indicated in each panel, was quantified by RT-qPCR with RNU-24 as a standard and normalized to the level in CD56bright NK cells. Differences between developmental stages are indicated: * p < 0.05, ** p < 0.01. Data shown are Avg and SEM of cells from 3 subjects, each sorted in a separate experiment.

