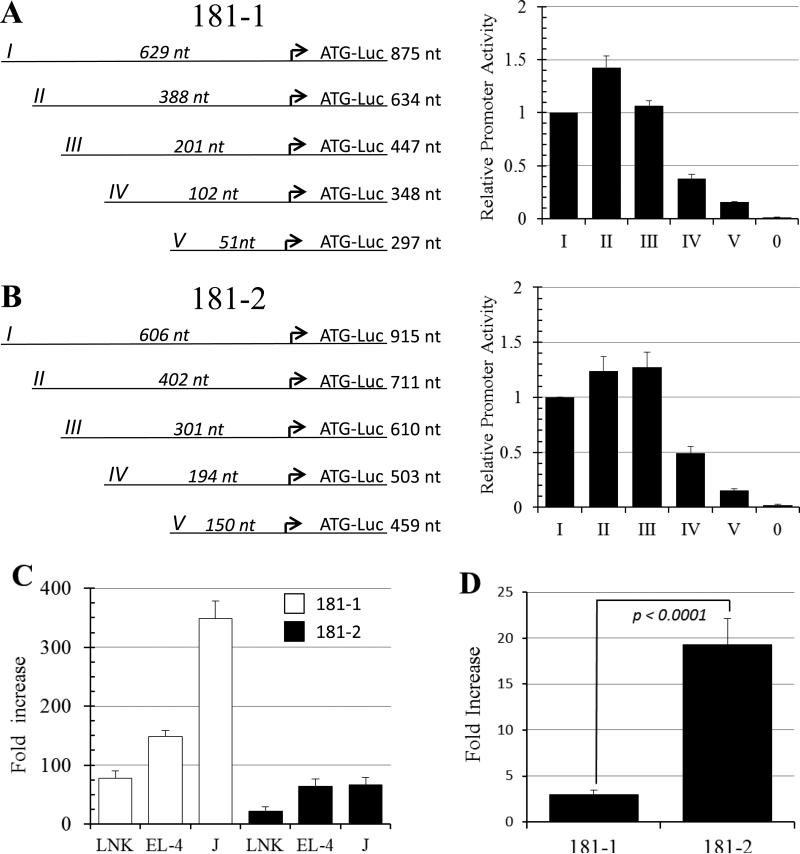
Figure 6.
Characterizing the MIR181A1B1 and MIR181A2B2 promoters. A, B. Shown are schematic views of promoter truncation experiments. The arrow indicates the major TSS. Full length (I) and truncation fragments (II-V) of the 181-1 (A) and 181-2 (B) promoter were transfected into YT-HY NK cells and promoter activity was measured as described in Materials and Methods. The length of the promoter fragment 5’ of the major TSS and the length of the total promoter fragment are shown. pXPG-181-1-I-Luc or pXPG-181-2-I-Luc produced luciferase values that were 70-fold and 45-fold above empty vector background. Values represent averages from tests of 2-4 different plasmid preparations over at least two different experiments. “0” indicates background level produced by the empty pXPG-Luc basic vector. C. MIR181 promoters are active in T and NK cell lines. The white and back bars indicate the 181-1 and 181-2 promoters, respectively. Fold increase refers to normalized luciferase activity compared to the empty pXPGLuc basic vector. The experiment was done 3 times with two different plasmid preps each time; all Avg were significant above those of the empty vector (*p < 0.002). D. SMAD3/4 strongly transactivate the 181-2 promoter. HepG2 cells were transfected with pXPG-181-1-I-Luc and pXPG-181-2-I-Luc reporter plasmids, along with expression constructs for SMAD3 and 4, or empty vector. Fold increase refers to transactivation activity of SMAD3/4 divided transactivation activity by empty vector. Shown is Avg and SEM of 5 experiments.

