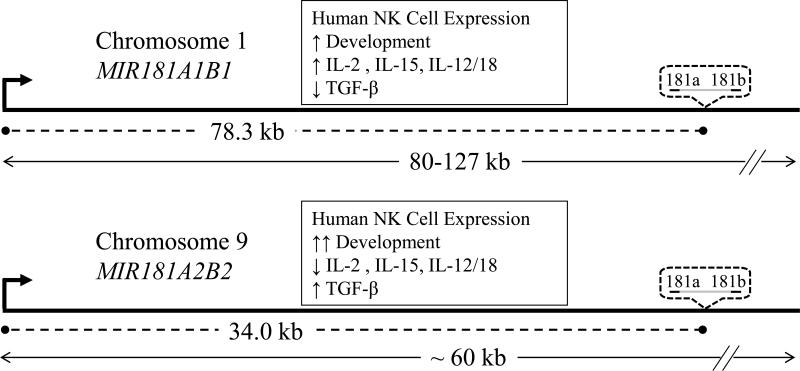
Figure 7.
Schematic diagram showing the distances (dashed lines) between human MIR181A1B1 and MIR181A2B2 TSS (bent arrows) and mature miRNA coding sequences (dotted bubbles) and length (double arrow lines) of the pri-miRNAs. Distances are not drawn to scale. Summarized is human NK cell differential regulation of MIR181A1B1 and MIR181A2B2 gene expression in response to developmental signals and immune regulatory cytokines (boxes).

