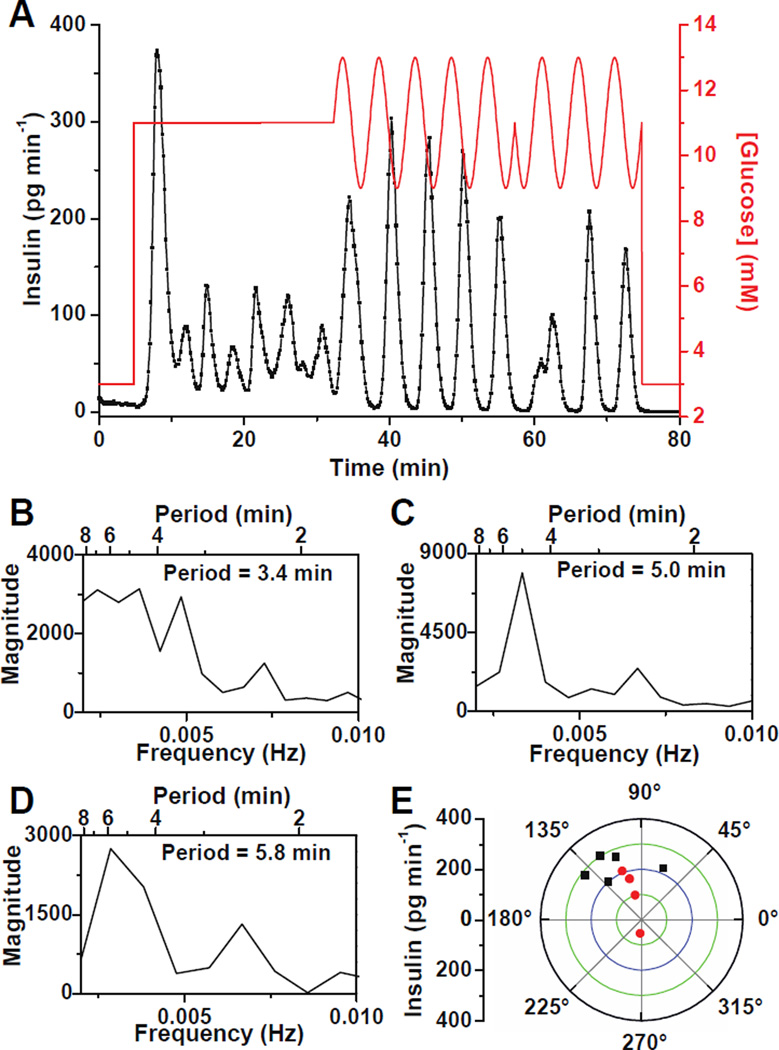
Figure 4. Entrainment of insulin secretion from single islets to an oscillatory glucose level.
(A) Glucose was raised from 3 mM to 11 mM to induce oscillatory insulin secretion from a single islet. The glucose concentration was then made to oscillate around a mean of 11 mM with a period of 5 min and amplitude of 2 mM. After 25 min, a 180° phase shift was introduced to the sinusoidal glucose wave. (B – D) Spectral analysis of the data in (A) when the islet was perfused with (B) constant 11 mM glucose from 5 – 32 min, (C) oscillatory glucose with a period of 5 min from 32 – 57 min, and (D) oscillatory glucose with a period of 5 min from 57 – 75 min after the 180° phase shift. (E) Phase angles of the insulin pulses to the glucose waves on a polar plot where the amplitude of insulin is indicated by the radial distance. The black points show phase angles when the islet was perfused with sinusoidal glucose waves with a period of 5 min from 32 – 57 min and red points indicate phase angles after the 180° phase shift in glucose (57 – 75 min).

