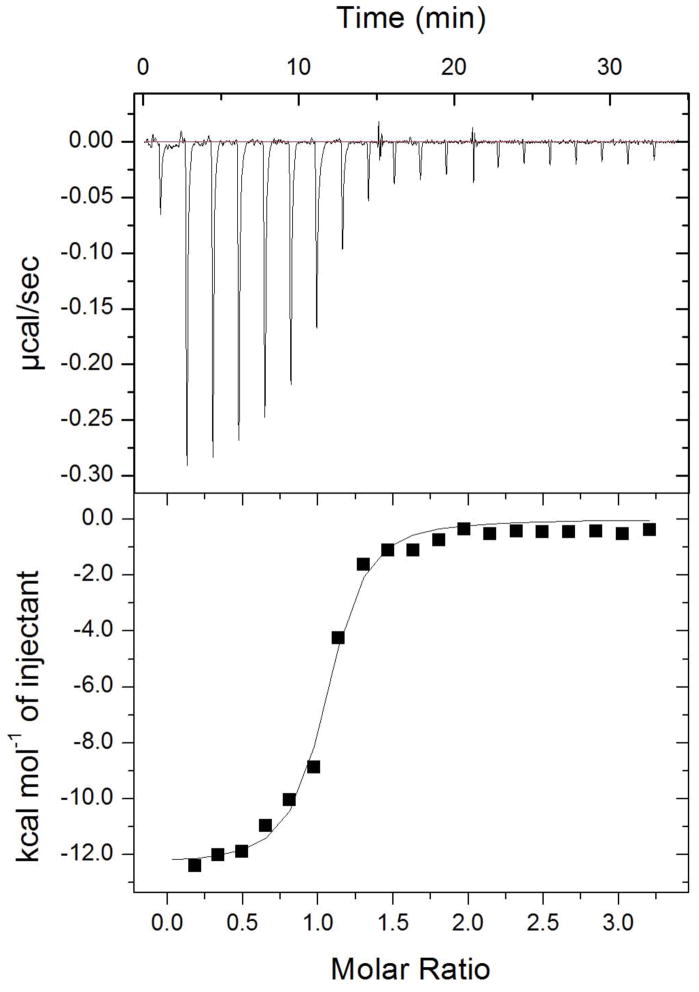
Figure 6.
Isothermal titration calorimetry profile of BioA (10 μM) with 14 (103 μM). Experiments were performed as described in the Experimental Procedures. The top panel shows data obtained from automatic titrations of 200 μL of 14. The bottom panel shows the integrated curve showing experimental points (➄) and the best fit (–). A fit of the data to a one-set-of-sites model produced the following values for the binding of 14 to BioA (average from duplicate experiments): n = 0.73 ± 0.11, ΔH = −11.8 ± 0.8 kcal mmol−1, −TΔS = 2.3 ± 0.8 kcal mol−1; and KA = (9.23 ± 0.89) × 106 M−1.

