
Figure 2.
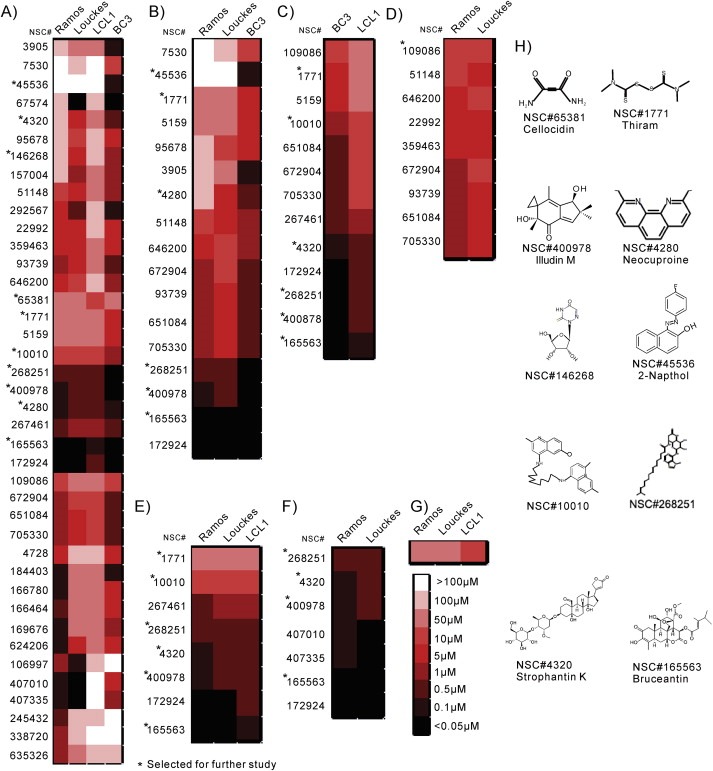
Determination of 50% growth inhibitory concentrations (GI 50 ) of 40 selected small molecules and chemical structures for 10 selected small molecules. GFP‐expressing BC3, LCL1, Louckes and Ramos cells were treated in a gradient of 8 drug concentrations from 100 μM to 0.05 μM in half log steps. Compounds which showed GI50 at 0.05 μM for a particular cell line is shown in highest intense color and as expected the cell lines showing a GI50 at 100 μM had the least intense color. Results were clustered by hierarchical clustering complete linkage. A) Results were ordered by hierarchical clustering based on lethality pattern. The molecules selected for further study show significant levels of specificity or overall lethality. B) Molecules specific to BC3. C) Molecules specific to KSHV and EBV‐infected cell lines. D) Molecules showing similar responses in Burkitt's lymphoma cell lines. E) Most generally lethal molecules, F) Molecules most lethal in Burkitt's lymphoma cell lines. G) Molecules specifically lethal to the EBV‐infected cell line. H) Structures and names of 10 molecules selected from growth inhibition data as specifically lethal to either EBV or KSHV‐infected cells or lethal to cell lines in our screen.